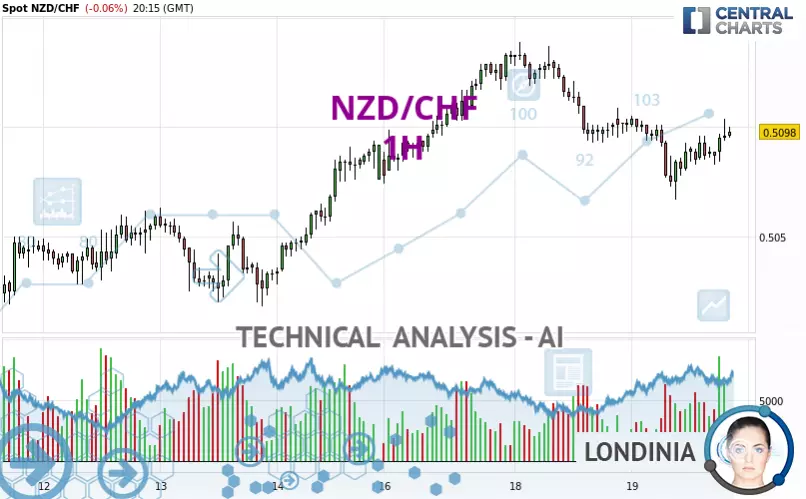
NZD/CHF - 1H - Technical analysis published on 03/19/2025 (GMT)
- 66
- 0
Click here for a new analysis!
- Timeframe : 1H
- - Analysis generated on
- Status : INVALID

Summary of the analysis

Additional analysis
Quotes
The NZD/CHF price is 0.5098 CHF. On the day, this instrument lost -0.06% and was traded between 0.5067 CHF and 0.5105 CHF over the period. The price is currently at +0.61% from its lowest and -0.14% from its highest.So that you have an overall view of the price change, here is a table showing the variations over several periods:
Near a new LOW record (5 years)
Type : Bearish
Timeframe : Weekly
Near a new LOW record (1 year)
Type : Bearish
Timeframe : Weekly
Near a new HIGH record (1st january)
Type : Bullish
Timeframe : Weekly
Near a new HIGH record (1 month)
Type : Bullish
Timeframe : Weekly
Technical
A technical analysis in 1H of this NZD/CHF chart shows a slightly bullish trend. 57.14% of the signals given by moving averages are bullish. The slightly bullish signals given by short-term moving averages do not show a strengthening of this global trend. There is no crossing of moving average by the price or crossing of moving averages between themselves.
Technical indicators are strongly bullish, suggesting that the price increase should continue.
The Central Indicators scanner specialised in technical indicators, has not detected anything further.
An analysis of the price chart with the Central Patterns scanner (detector of chart patterns and resistances and supports) shows several results that can have an impact on the price change:
Near horizontal support
Type : Bullish
Timeframe : 1 hour
Support of channel is broken
Type : Bearish
Timeframe : 1 hour
The Central Candlesticks scanner which studies Japanese candlesticks did not detect anything.
| S3 | S2 | S1 | Price | R1 | R2 | R3 | |
|---|---|---|---|---|---|---|---|
| ProTrendLines | 0.5046 | 0.5063 | 0.5087 | 0.5098 | 0.5119 | 0.5139 | 0.5177 |
| Change (%) | -1.02% | -0.69% | -0.22% | - | +0.41% | +0.80% | +1.55% |
| Change | -0.0052 | -0.0035 | -0.0011 | - | +0.0021 | +0.0041 | +0.0079 |
| Level | Major | Minor | Major | - | Minor | Major | Intermediate |
To determine price objectives, it is also possible to use the pivot points. Here is the price position in relation to pivot points:
| Pivot points | S3 | S2 | S1 | PP | R1 | R2 | R3 |
|---|---|---|---|---|---|---|---|
| Standard | 0.5037 | 0.5065 | 0.5083 | 0.5111 | 0.5129 | 0.5157 | 0.5175 |
| Camarilla | 0.5088 | 0.5093 | 0.5097 | 0.5101 | 0.5105 | 0.5109 | 0.5114 |
| Woodie | 0.5032 | 0.5063 | 0.5078 | 0.5109 | 0.5124 | 0.5155 | 0.5170 |
| Fibonacci | 0.5065 | 0.5083 | 0.5093 | 0.5111 | 0.5129 | 0.5139 | 0.5157 |
| Pivot points | S3 | S2 | S1 | PP | R1 | R2 | R3 |
|---|---|---|---|---|---|---|---|
| Standard | 0.4909 | 0.4947 | 0.5019 | 0.5057 | 0.5129 | 0.5167 | 0.5239 |
| Camarilla | 0.5062 | 0.5072 | 0.5082 | 0.5092 | 0.5102 | 0.5112 | 0.5122 |
| Woodie | 0.4927 | 0.4956 | 0.5037 | 0.5066 | 0.5147 | 0.5176 | 0.5257 |
| Fibonacci | 0.4947 | 0.4989 | 0.5015 | 0.5057 | 0.5099 | 0.5125 | 0.5167 |
| Pivot points | S3 | S2 | S1 | PP | R1 | R2 | R3 |
|---|---|---|---|---|---|---|---|
| Standard | 0.4842 | 0.4938 | 0.4995 | 0.5091 | 0.5148 | 0.5244 | 0.5301 |
| Camarilla | 0.5011 | 0.5025 | 0.5039 | 0.5053 | 0.5067 | 0.5081 | 0.5095 |
| Woodie | 0.4824 | 0.4928 | 0.4977 | 0.5081 | 0.5130 | 0.5234 | 0.5283 |
| Fibonacci | 0.4938 | 0.4996 | 0.5032 | 0.5091 | 0.5149 | 0.5185 | 0.5244 |
Numerical data
The following are the details of the technical indicators and moving averages that were collected to generate this technical analysis:
| RSI (14): | 52.62 | |
| MACD (12,26,9): | -0.0002 | |
| Directional Movement: | 5.6751 | |
| AROON (14): | 71.4285 | |
| DEMA (21): | 0.5089 | |
| Parabolic SAR (0,02-0,02-0,2): | 0.5072 | |
| Elder Ray (13): | 0.0005 | |
| Super Trend (3,10): | 0.5105 | |
| Zig ZAG (10): | 0.5098 | |
| VORTEX (21): | 0.9841 | |
| Stochastique (14,3,5): | 81.51 | |
| TEMA (21): | 0.5090 | |
| Williams %R (14): | -16.22 | |
| Chande Momentum Oscillator (20): | 0.0022 | |
| Repulse (5,40,3): | 0.0522 | |
| ROCnROLL: | 1 | |
| TRIX (15,9): | -0.0141 | |
| Courbe Coppock: | 0.04 |
| MA7: | 0.5080 | |
| MA20: | 0.5081 | |
| MA50: | 0.5113 | |
| MA100: | 0.5135 | |
| MAexp7: | 0.5093 | |
| MAexp20: | 0.5093 | |
| MAexp50: | 0.5096 | |
| MAexp100: | 0.5090 | |
| Price / MA7: | +0.35% | |
| Price / MA20: | +0.33% | |
| Price / MA50: | -0.29% | |
| Price / MA100: | -0.72% | |
| Price / MAexp7: | +0.10% | |
| Price / MAexp20: | +0.10% | |
| Price / MAexp50: | +0.04% | |
| Price / MAexp100: | +0.16% |
News
Don't forget to follow the news on NZD/CHF. At the time of publication of this analysis, the latest news was as follows:
-
 NZD/CHF Forecast November 18, 2024
-
NZD/CHF Forecast October 29, 2024
-
NZD/CHF Forecast September 12, 2024
-
NZD/CHF Forecast August 19, 2024
-
NZD/CHF Forecast August 14, 2024
About author
Online


Add a comment
Comments
0 comments on the analysis NZD/CHF - 1H