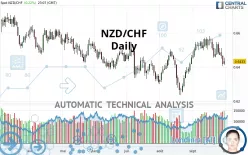
NZD/CHF - Daily - Technical analysis published on 09/30/2021 (GMT)
- 235
- 1
Click here for a new analysis!
- Timeframe : Daily
- - Analysis generated on
- Status : INVALID

Summary of the analysis

Additional analysis
Quotes
The NZD/CHF price is 0.6433 CHF. The price registered an increase of +0.22% on the session and was traded between 0.6413 CHF and 0.6454 CHF over the period. The price is currently at +0.31% from its lowest and -0.33% from its highest.The Central Gaps scanner detects a bullish opening marking the presence of buyers ahead of sellers at the opening but not sufficiently marked to allow the price to register a quotation gap.
Bullish opening
Type : Bullish
Timeframe : Openning
So that you have an overall view of the price change, here is a table showing the variations over several periods:
Technical
Technical analysis of NZD/CHF in Daily shows an overall bearish trend. 67.86% of the signals given by moving averages are bearish. This bearish trend is supported by the strong bearish signals given by short-term moving averages. The Central Indicators scanner detects bearish signals on moving averages that could impact this trend:
Bearish trend reversal : Moving Average 20
Type : Bearish
Timeframe : Daily
Bearish trend reversal : adaptative moving average 50
Type : Bearish
Timeframe : Daily
Bearish trend reversal : adaptative moving average 100
Type : Bearish
Timeframe : Daily
Bearish price crossover with Moving Average 50
Type : Bearish
Timeframe : Daily
Bearish price crossover with Moving Average 100
Type : Bearish
Timeframe : Daily
Bearish price crossover with adaptative moving average 50
Type : Bearish
Timeframe : Daily
The technical indicators are generally neutral. They do not provide relevant information on the direction of future price movements.
Caution: the Central Indicators scanner currently detects an excess:
CCI indicator is oversold : under -100
Type : Neutral
Timeframe : Daily
Williams %R indicator is oversold : under -80
Type : Neutral
Timeframe : Daily
Pivot points : price is under support 1
Type : Neutral
Timeframe : Weekly
Price is back under the pivot point
Type : Bearish
Timeframe : Daily
An analysis of the price chart with the Central Patterns scanner (detector of chart patterns and resistances and supports) shows a result that can have an impact on the price change:
Support of channel is broken
Type : Bearish
Timeframe : Daily
The Central Candlesticks scanner, specialised in Japanese candlesticks, did not identify any signals.
| S3 | S2 | S1 | R1 | Price | R2 | R3 | |
|---|---|---|---|---|---|---|---|
| ProTrendLines | 0.6031 | 0.6273 | 0.6355 | 0.6433 | 0.6433 | 0.6487 | 0.6552 |
| Change (%) | -6.25% | -2.49% | -1.21% | 0% | - | +0.84% | +1.85% |
| Change | -0.0402 | -0.0160 | -0.0078 | 0 | - | +0.0054 | +0.0119 |
| Level | Major | Major | Minor | Intermediate | - | Intermediate | Major |
Attention could also be paid to pivot points to set price objectives:
| Pivot points | S3 | S2 | S1 | PP | R1 | R2 | R3 |
|---|---|---|---|---|---|---|---|
| Standard | 0.6332 | 0.6369 | 0.6394 | 0.6431 | 0.6456 | 0.6493 | 0.6518 |
| Camarilla | 0.6402 | 0.6408 | 0.6413 | 0.6419 | 0.6425 | 0.6430 | 0.6436 |
| Woodie | 0.6326 | 0.6366 | 0.6388 | 0.6428 | 0.6450 | 0.6490 | 0.6512 |
| Fibonacci | 0.6369 | 0.6393 | 0.6407 | 0.6431 | 0.6455 | 0.6469 | 0.6493 |
| Pivot points | S3 | S2 | S1 | PP | R1 | R2 | R3 |
|---|---|---|---|---|---|---|---|
| Standard | 0.6323 | 0.6388 | 0.6436 | 0.6501 | 0.6549 | 0.6614 | 0.6662 |
| Camarilla | 0.6454 | 0.6464 | 0.6475 | 0.6485 | 0.6495 | 0.6506 | 0.6516 |
| Woodie | 0.6316 | 0.6384 | 0.6429 | 0.6497 | 0.6542 | 0.6610 | 0.6655 |
| Fibonacci | 0.6388 | 0.6431 | 0.6458 | 0.6501 | 0.6544 | 0.6571 | 0.6614 |
| Pivot points | S3 | S2 | S1 | PP | R1 | R2 | R3 |
|---|---|---|---|---|---|---|---|
| Standard | 0.6022 | 0.6129 | 0.6291 | 0.6398 | 0.6560 | 0.6667 | 0.6829 |
| Camarilla | 0.6380 | 0.6405 | 0.6429 | 0.6454 | 0.6479 | 0.6503 | 0.6528 |
| Woodie | 0.6051 | 0.6143 | 0.6320 | 0.6412 | 0.6589 | 0.6681 | 0.6858 |
| Fibonacci | 0.6129 | 0.6231 | 0.6295 | 0.6398 | 0.6500 | 0.6564 | 0.6667 |
Numerical data
The following is the status of the technical indicators and moving averages at the time of publication of this technical analysis:
| RSI (14): | 43.82 | |
| MACD (12,26,9): | 0.0002 | |
| Directional Movement: | -6.0010 | |
| AROON (14): | -64.2857 | |
| DEMA (21): | 0.6490 | |
| Parabolic SAR (0,02-0,02-0,2): | 0.6539 | |
| Elder Ray (13): | -0.0045 | |
| Super Trend (3,10): | 0.6402 | |
| Zig ZAG (10): | 0.6429 | |
| VORTEX (21): | 0.9703 | |
| Stochastique (14,3,5): | 10.86 | |
| TEMA (21): | 0.6475 | |
| Williams %R (14): | -86.93 | |
| Chande Momentum Oscillator (20): | -0.0098 | |
| Repulse (5,40,3): | -0.8902 | |
| ROCnROLL: | 2 | |
| TRIX (15,9): | 0.0482 | |
| Courbe Coppock: | 1.87 |
| MA7: | 0.6470 | |
| MA20: | 0.6510 | |
| MA50: | 0.6435 | |
| MA100: | 0.6444 | |
| MAexp7: | 0.6463 | |
| MAexp20: | 0.6479 | |
| MAexp50: | 0.6460 | |
| MAexp100: | 0.6455 | |
| Price / MA7: | -0.57% | |
| Price / MA20: | -1.18% | |
| Price / MA50: | -0.03% | |
| Price / MA100: | -0.17% | |
| Price / MAexp7: | -0.46% | |
| Price / MAexp20: | -0.71% | |
| Price / MAexp50: | -0.42% | |
| Price / MAexp100: | -0.34% |
News
The last news published on NZD/CHF at the time of the generation of this analysis was as follows:
About author

Online


Add a comment
Comments
1 comments on the analysis NZD/CHF - Daily