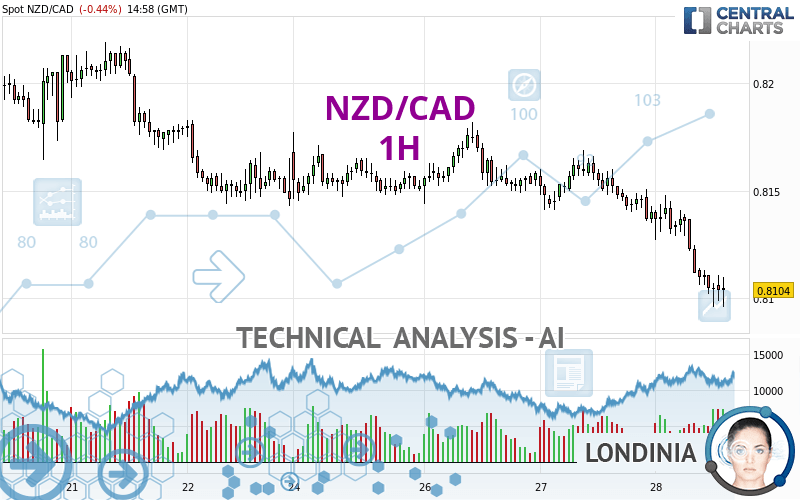
NZD/CAD - 1H - Technical analysis published on 03/28/2024 (GMT)
- 109
- 0
Click here for a new analysis!
- Timeframe : 1H
- - Analysis generated on
- Status : TARGET REACHED

Summary of the analysis

Additional analysis
Quotes
The NZD/CAD rating is 0.8103 CAD. The price is lower by -0.46% since the last closing and was between 0.8096 CAD and 0.8148 CAD. This implies that the price is at +0.09% from its lowest and at -0.55% from its highest.Here is a more detailed summary of the historical variations registered by NZD/CAD:
Near a new HIGH record (1 year)
Type : Bullish
Timeframe : Weekly
Near a new HIGH record (1st january)
Type : Bullish
Timeframe : Weekly
New LOW record (1st january)
Type : Bearish
Timeframe : Weekly
Near a new HIGH record (1 month)
Type : Bullish
Timeframe : Weekly
New LOW record (1 month)
Type : Bearish
Timeframe : Weekly
Technical
Technical analysis of this 1H chart of NZD/CAD indicates that the overall trend is strongly bearish. 92.86% of the signals given by moving averages are bearish. This strongly bearish trend is supported by the strong bearish signals given by short-term moving averages. The Central Indicators scanner does not detect any result on moving averages that would impact this trend.
In fact, according to the parameters integrated into the Central Analyzer system, 11 technical indicators out of 18 analysed are currently bearish. Caution: the Central Indicators scanner currently detects an excess:
RSI indicator is oversold : under 30
Type : Neutral
Timeframe : 1 hour
CCI indicator is oversold : under -100
Type : Neutral
Timeframe : 1 hour
Williams %R indicator is oversold : under -80
Type : Neutral
Timeframe : 1 hour
Pivot points : price is under support 1
Type : Neutral
Timeframe : Weekly
Pivot points : price is under support 3
Type : Neutral
Timeframe : 1 hour
The Central Patterns scanner, which studies chart patterns, resistances and supports, has identified these signals:
Near horizontal support
Type : Bullish
Timeframe : 1 hour
Support of channel is broken
Type : Bearish
Timeframe : 1 hour
Central Candlesticks, the scanner specialised in Japanese candlesticks, detects this inversion signal that could impact the current short-term trend:
Doji
Type : Neutral
Timeframe : 1 hour
| S3 | S2 | S1 | Price | R1 | R2 | R3 | |
|---|---|---|---|---|---|---|---|
| ProTrendLines | 0.7977 | 0.8025 | 0.8090 | 0.8103 | 0.8144 | 0.8169 | 0.8186 |
| Change (%) | -1.55% | -0.96% | -0.16% | - | +0.51% | +0.81% | +1.02% |
| Change | -0.0126 | -0.0078 | -0.0013 | - | +0.0041 | +0.0066 | +0.0083 |
| Level | Major | Minor | Minor | - | Major | Minor | Major |
Attention could also be paid to pivot points to set price objectives:
| Pivot points | S3 | S2 | S1 | PP | R1 | R2 | R3 |
|---|---|---|---|---|---|---|---|
| Standard | 0.8093 | 0.8114 | 0.8127 | 0.8148 | 0.8161 | 0.8182 | 0.8195 |
| Camarilla | 0.8131 | 0.8134 | 0.8137 | 0.8140 | 0.8143 | 0.8146 | 0.8149 |
| Woodie | 0.8089 | 0.8112 | 0.8123 | 0.8146 | 0.8157 | 0.8180 | 0.8191 |
| Fibonacci | 0.8114 | 0.8127 | 0.8135 | 0.8148 | 0.8161 | 0.8169 | 0.8182 |
| Pivot points | S3 | S2 | S1 | PP | R1 | R2 | R3 |
|---|---|---|---|---|---|---|---|
| Standard | 0.7996 | 0.8069 | 0.8108 | 0.8181 | 0.8220 | 0.8293 | 0.8332 |
| Camarilla | 0.8115 | 0.8126 | 0.8136 | 0.8146 | 0.8156 | 0.8167 | 0.8177 |
| Woodie | 0.7978 | 0.8061 | 0.8090 | 0.8173 | 0.8202 | 0.8285 | 0.8314 |
| Fibonacci | 0.8069 | 0.8112 | 0.8139 | 0.8181 | 0.8224 | 0.8251 | 0.8293 |
| Pivot points | S3 | S2 | S1 | PP | R1 | R2 | R3 |
|---|---|---|---|---|---|---|---|
| Standard | 0.7924 | 0.8038 | 0.8148 | 0.8262 | 0.8372 | 0.8486 | 0.8596 |
| Camarilla | 0.8197 | 0.8218 | 0.8239 | 0.8259 | 0.8280 | 0.8300 | 0.8321 |
| Woodie | 0.7923 | 0.8037 | 0.8147 | 0.8261 | 0.8371 | 0.8485 | 0.8595 |
| Fibonacci | 0.8038 | 0.8123 | 0.8176 | 0.8262 | 0.8347 | 0.8400 | 0.8486 |
Numerical data
The following are the details of the technical indicators and moving averages that were collected to generate this technical analysis:
| RSI (14): | 24.68 | |
| MACD (12,26,9): | -0.0012 | |
| Directional Movement: | -19.0732 | |
| AROON (14): | -71.4286 | |
| DEMA (21): | 0.8109 | |
| Parabolic SAR (0,02-0,02-0,2): | 0.8130 | |
| Elder Ray (13): | -0.0014 | |
| Super Trend (3,10): | 0.8132 | |
| Zig ZAG (10): | 0.8105 | |
| VORTEX (21): | 0.7763 | |
| Stochastique (14,3,5): | 16.03 | |
| TEMA (21): | 0.8103 | |
| Williams %R (14): | -84.62 | |
| Chande Momentum Oscillator (20): | -0.0039 | |
| Repulse (5,40,3): | -0.0367 | |
| ROCnROLL: | 2 | |
| TRIX (15,9): | -0.0169 | |
| Courbe Coppock: | 0.78 |
| MA7: | 0.8155 | |
| MA20: | 0.8236 | |
| MA50: | 0.8246 | |
| MA100: | 0.8276 | |
| MAexp7: | 0.8109 | |
| MAexp20: | 0.8124 | |
| MAexp50: | 0.8138 | |
| MAexp100: | 0.8152 | |
| Price / MA7: | -0.64% | |
| Price / MA20: | -1.61% | |
| Price / MA50: | -1.73% | |
| Price / MA100: | -2.09% | |
| Price / MAexp7: | -0.07% | |
| Price / MAexp20: | -0.26% | |
| Price / MAexp50: | -0.43% | |
| Price / MAexp100: | -0.60% |
News
The last news published on NZD/CAD at the time of the generation of this analysis was as follows:
-
 Trading into 2024: Rules of Alternation in Elliot Wave using NZD/CAD
-
New Zealand Dollar Soars on RBNZ: NZD/USD, NZD/JPY, NZD/CAD Analysis
-
Quick Takes Video: Volatility vs Inevitability for USD/CAD, NZD/JPY, NZD/CAD
-
NZD/CAD To Potentially Reach Parity
About author

Online


Add a comment
Comments
0 comments on the analysis NZD/CAD - 1H