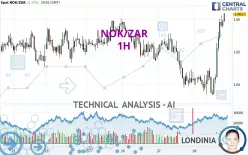
NOK/ZAR - 1H - Technical analysis published on 02/28/2025 (GMT)
- 75
- 0
Click here for a new analysis!
- Timeframe : 1H
- - Analysis generated on
- Status : TARGET REACHED

Summary of the analysis

Additional analysis
Quotes
NOK/ZAR rating 1.6618 ZAR. The price registered an increase of +1.24% on the session with the lowest point at 1.6367 ZAR and the highest point at 1.6619 ZAR. The deviation from the price is +1.53% for the low point and -0.01% for the high point.A study of price movements over other periods shows the following variations:
Near a new LOW record (5 years)
Type : Bearish
Timeframe : Weekly
Near a new LOW record (1 year)
Type : Bearish
Timeframe : Weekly
Near a new HIGH record (1st january)
Type : Bullish
Timeframe : Weekly
Near a new HIGH record (1 month)
Type : Bullish
Timeframe : Weekly
Technical
A technical analysis in 1H of this NOK/ZAR chart shows a bullish trend. 75.00% of the signals given by moving averages are bullish. The overall trend is reinforced by the strong bullish signals from short-term moving averages. The Central Indicators market scanner currently does not detect any result that concerns moving averages.
Technical indicators are strongly bullish, suggesting that the price increase should continue.
The Central Indicators scanner found this result concerning these indicators:
Price is back over the pivot point
Type : Bullish
Timeframe : Weekly
Central Patterns, the market scanner focusing on chart patterns, resistances and supports found these results:
Near horizontal resistance
Type : Bearish
Timeframe : 1 hour
Resistance of channel is broken
Type : Bullish
Timeframe : 1 hour
The Central Candlesticks scanner, specialised in Japanese candlesticks, did not identify any signals.
| S3 | S2 | S1 | Price | R1 | R2 | R3 | |
|---|---|---|---|---|---|---|---|
| ProTrendLines | 1.6472 | 1.6556 | 1.6602 | 1.6618 | 1.6694 | 1.7000 | 1.7505 |
| Change (%) | -0.88% | -0.37% | -0.10% | - | +0.46% | +2.30% | +5.34% |
| Change | -0.0146 | -0.0062 | -0.0016 | - | +0.0076 | +0.0382 | +0.0887 |
| Level | Intermediate | Intermediate | Minor | - | Intermediate | Major | Intermediate |
Attention could also be paid to pivot points to set price objectives:
| Pivot points | S3 | S2 | S1 | PP | R1 | R2 | R3 |
|---|---|---|---|---|---|---|---|
| Standard | 1.6185 | 1.6288 | 1.6351 | 1.6454 | 1.6517 | 1.6620 | 1.6683 |
| Camarilla | 1.6369 | 1.6385 | 1.6400 | 1.6415 | 1.6430 | 1.6445 | 1.6461 |
| Woodie | 1.6166 | 1.6278 | 1.6332 | 1.6444 | 1.6498 | 1.6610 | 1.6664 |
| Fibonacci | 1.6288 | 1.6351 | 1.6390 | 1.6454 | 1.6517 | 1.6556 | 1.6620 |
| Pivot points | S3 | S2 | S1 | PP | R1 | R2 | R3 |
|---|---|---|---|---|---|---|---|
| Standard | 1.6155 | 1.6305 | 1.6396 | 1.6546 | 1.6637 | 1.6787 | 1.6878 |
| Camarilla | 1.6422 | 1.6444 | 1.6466 | 1.6488 | 1.6510 | 1.6532 | 1.6554 |
| Woodie | 1.6127 | 1.6290 | 1.6368 | 1.6531 | 1.6609 | 1.6772 | 1.6850 |
| Fibonacci | 1.6305 | 1.6397 | 1.6454 | 1.6546 | 1.6638 | 1.6695 | 1.6787 |
| Pivot points | S3 | S2 | S1 | PP | R1 | R2 | R3 |
|---|---|---|---|---|---|---|---|
| Standard | 1.5799 | 1.6036 | 1.6263 | 1.6500 | 1.6727 | 1.6964 | 1.7191 |
| Camarilla | 1.6362 | 1.6405 | 1.6448 | 1.6490 | 1.6533 | 1.6575 | 1.6618 |
| Woodie | 1.5794 | 1.6034 | 1.6258 | 1.6498 | 1.6722 | 1.6962 | 1.7186 |
| Fibonacci | 1.6036 | 1.6213 | 1.6323 | 1.6500 | 1.6677 | 1.6787 | 1.6964 |
Numerical data
The following is the status of the technical indicators and moving averages at the time of publication of this technical analysis:
| RSI (14): | 73.12 | |
| MACD (12,26,9): | 0.0036 | |
| Directional Movement: | 26.2819 | |
| AROON (14): | 57.1429 | |
| DEMA (21): | 1.6524 | |
| Parabolic SAR (0,02-0,02-0,2): | 1.6425 | |
| Elder Ray (13): | 0.0091 | |
| Super Trend (3,10): | 1.6483 | |
| Zig ZAG (10): | 1.6609 | |
| VORTEX (21): | 1.2350 | |
| Stochastique (14,3,5): | 92.77 | |
| TEMA (21): | 1.6570 | |
| Williams %R (14): | -2.82 | |
| Chande Momentum Oscillator (20): | 0.0197 | |
| Repulse (5,40,3): | 0.3683 | |
| ROCnROLL: | 1 | |
| TRIX (15,9): | 0.0075 | |
| Courbe Coppock: | 1.65 |
| MA7: | 1.6516 | |
| MA20: | 1.6514 | |
| MA50: | 1.6492 | |
| MA100: | 1.6339 | |
| MAexp7: | 1.6554 | |
| MAexp20: | 1.6490 | |
| MAexp50: | 1.6478 | |
| MAexp100: | 1.6493 | |
| Price / MA7: | +0.62% | |
| Price / MA20: | +0.63% | |
| Price / MA50: | +0.76% | |
| Price / MA100: | +1.71% | |
| Price / MAexp7: | +0.39% | |
| Price / MAexp20: | +0.78% | |
| Price / MAexp50: | +0.85% | |
| Price / MAexp100: | +0.76% |
About author
Online


Add a comment
Comments
0 comments on the analysis NOK/ZAR - 1H