BIGBEN INTERACTIVE - 1H - Technical analysis published on 03/25/2024 (GMT)
- 160
- 0
Click here for a new analysis!
- Timeframe : 1H
- - Analysis generated on
- Status : TARGET REACHED

Summary of the analysis

Additional analysis
Quotes
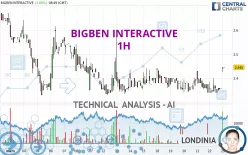
The BIGBEN INTERACTIVE price is 2.445 EUR. The price registered an increase of +3.60% on the session and was traded between 2.425 EUR and 2.445 EUR over the period. The price is currently at +0.82% from its lowest and 0% from its highest.The Central Gaps scanner detects a bullish gap which is a sign that buyers have taken the lead in the very short term.
Opening Gap UP
Type : Bullish
Timeframe : Openning
So that you have an overall view of the price change, here is a table showing the variations over several periods:
Near a new LOW record (1st january)
Type : Bearish
Timeframe : Weekly
Near a new LOW record (1 month)
Type : Bearish
Timeframe : Weekly
Technical
A technical analysis in 1H of this BIGBEN INTERACTIVE chart shows a slightly bullish trend. 60.71% of the signals given by moving averages are bullish. This slightly bullish trend could be reinforced by the strong bullish signals given by short-term moving averages. The Central Indicators market scanner is currently detecting several bullish signals that could impact this trend:
Bullish price crossover with Moving Average 20
Type : Bullish
Timeframe : 1 hour
Bullish price crossover with Moving Average 50
Type : Bullish
Timeframe : 1 hour
Bullish price crossover with Moving Average 100
Type : Bullish
Timeframe : 1 hour
Bullish price crossover with adaptative moving average 20
Type : Bullish
Timeframe : 1 hour
Bullish price crossover with adaptative moving average 50
Type : Bullish
Timeframe : 1 hour
Bullish price crossover with adaptative moving average 100
Type : Bullish
Timeframe : 1 hour
The probability of a further increase is high given the direction of the technical indicators.
Caution: the Central Indicators scanner currently detects an excess:
CCI indicator is overbought : over 100
Type : Neutral
Timeframe : 1 hour
Williams %R indicator is overbought : over -20
Type : Neutral
Timeframe : 1 hour
Pivot points : price is over resistance 1
Type : Neutral
Timeframe : Weekly
Pivot points : price is over resistance 2
Type : Neutral
Timeframe : 1 hour
RSI indicator is back over 50
Type : Bullish
Timeframe : 1 hour
Parabolic SAR indicator bullish reversal
Type : Bullish
Timeframe : 1 hour
Aroon indicator bullish trend
Type : Bullish
Timeframe : 1 hour
MACD indicator is back over 0
Type : Bullish
Timeframe : 1 hour
Momentum indicator is back over 0
Type : Bullish
Timeframe : 1 hour
The Central Patterns scanner, which studies chart patterns, resistances and supports, has identified these signals:
Near horizontal resistance
Type : Bearish
Timeframe : 1 hour
Resistance of channel is broken
Type : Bullish
Timeframe : 1 hour
No result was found by the Central Candlesticks scanner on Japanese candlesticks.
| S2 | S1 | Price | R1 | R2 | R3 | |
|---|---|---|---|---|---|---|
| ProTrendLines | 2.330 | 2.440 | 2.445 | 2.622 | 2.750 | 2.800 |
| Change (%) | -4.70% | -0.20% | - | +7.24% | +12.47% | +14.52% |
| Change | -0.115 | -0.005 | - | +0.177 | +0.305 | +0.355 |
| Level | Major | Intermediate | - | Major | Minor | Minor |
Pivot points can also be used to set your price objectives. Here is the price situation in relation to pivot points:
| Pivot points | S3 | S2 | S1 | PP | R1 | R2 | R3 |
|---|---|---|---|---|---|---|---|
| Standard | 2.273 | 2.307 | 2.333 | 2.367 | 2.393 | 2.427 | 2.453 |
| Camarilla | 2.344 | 2.349 | 2.355 | 2.360 | 2.366 | 2.371 | 2.377 |
| Woodie | 2.270 | 2.305 | 2.330 | 2.365 | 2.390 | 2.425 | 2.450 |
| Fibonacci | 2.307 | 2.330 | 2.344 | 2.367 | 2.390 | 2.404 | 2.427 |
| Pivot points | S3 | S2 | S1 | PP | R1 | R2 | R3 |
|---|---|---|---|---|---|---|---|
| Standard | 2.220 | 2.280 | 2.320 | 2.380 | 2.420 | 2.480 | 2.520 |
| Camarilla | 2.333 | 2.342 | 2.351 | 2.360 | 2.369 | 2.378 | 2.388 |
| Woodie | 2.210 | 2.275 | 2.310 | 2.375 | 2.410 | 2.475 | 2.510 |
| Fibonacci | 2.280 | 2.318 | 2.342 | 2.380 | 2.418 | 2.442 | 2.480 |
| Pivot points | S3 | S2 | S1 | PP | R1 | R2 | R3 |
|---|---|---|---|---|---|---|---|
| Standard | 1.680 | 2.090 | 2.370 | 2.780 | 3.060 | 3.470 | 3.750 |
| Camarilla | 2.460 | 2.524 | 2.587 | 2.650 | 2.713 | 2.777 | 2.840 |
| Woodie | 1.615 | 2.058 | 2.305 | 2.748 | 2.995 | 3.438 | 3.685 |
| Fibonacci | 2.090 | 2.354 | 2.516 | 2.780 | 3.044 | 3.206 | 3.470 |
Numerical data
The following is the status of technical indicators and moving averages registered at the time this technical analysis was created:
| RSI (14): | 65.68 | |
| MACD (12,26,9): | 0.0010 | |
| Directional Movement: | 28.043 | |
| AROON (14): | 71.429 | |
| DEMA (21): | 2.369 | |
| Parabolic SAR (0,02-0,02-0,2): | 2.340 | |
| Elder Ray (13): | 0.064 | |
| Super Trend (3,10): | 2.348 | |
| Zig ZAG (10): | 2.445 | |
| VORTEX (21): | 0.9330 | |
| Stochastique (14,3,5): | 55.56 | |
| TEMA (21): | 2.374 | |
| Williams %R (14): | 0.00 | |
| Chande Momentum Oscillator (20): | 0.070 | |
| Repulse (5,40,3): | 0.5430 | |
| ROCnROLL: | 1 | |
| TRIX (15,9): | -0.0330 | |
| Courbe Coppock: | 0.84 |
| MA7: | 2.385 | |
| MA20: | 2.461 | |
| MA50: | 2.783 | |
| MA100: | 3.086 | |
| MAexp7: | 2.378 | |
| MAexp20: | 2.370 | |
| MAexp50: | 2.377 | |
| MAexp100: | 2.406 | |
| Price / MA7: | +2.52% | |
| Price / MA20: | -0.65% | |
| Price / MA50: | -12.15% | |
| Price / MA100: | -20.77% | |
| Price / MAexp7: | +2.82% | |
| Price / MAexp20: | +3.16% | |
| Price / MAexp50: | +2.86% | |
| Price / MAexp100: | +1.62% |
News
The latest news and videos published on BIGBEN INTERACTIVE at the time of the analysis were as follows:
- PRESS RELEASE: PARANOIA: HAPPINESS IS MANDATORY TO RELAUNCH WORLDWIDE ON DECEMBER 21, 2023
- PRESS RELEASE: BIGBEN: FIRST HALF 2023/24 RESULTS - English version
- PRESS RELEASE: BIGBEN: FIRST HALF 2023/24 SALES: €131.1 million
- PRESS RELEASE: BIGBEN: FIRST-QUARTER 2023/24 SALES: €66.5 million
- PRESS RELEASE: BIGBEN: DISTRIBUTION OF DIVIDEND IN KIND OF NACON SHARES
About author
Online


Add a comment
Comments
0 comments on the analysis BIGBEN INTERACTIVE - 1H