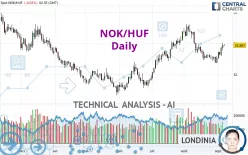
NOK/HUF - Daily - Technical analysis published on 09/07/2023 (GMT)
- 122
- 0
Click here for a new analysis!
- Timeframe : Daily
- - Analysis generated on
- Status : TARGET REACHED

Summary of the analysis

Additional analysis
Quotes
NOK/HUF rating 33.891 HUF. On the day, this instrument lost -0.01% with the lowest point at 33.864 HUF and the highest point at 33.971 HUF. The deviation from the price is +0.08% for the low point and -0.24% for the high point.The Central Gaps scanner detects a bearish opening marking the presence of sellers ahead of buyers at the opening but not sufficiently marked to allow the price to register a quotation gap.
Bearish opening
Type : Bearish
Timeframe : Openning
Here is a more detailed summary of the historical variations registered by NOK/HUF:
Near a new HIGH record (1 month)
Type : Bullish
Timeframe : Weekly
Technical
A technical analysis in Daily of this NOK/HUF chart shows a strongly bullish trend. 82.14% of the signals given by moving averages are bullish. The slightly bullish signals given by the short-term moving averages show a weakening of the global trend. The Central Indicators scanner does not detect any result on moving averages that would impact this trend.
The technical indicators are bullish. There is still some doubt about the price increase.
Caution: the Central Indicators scanner currently detects an excess:
CCI indicator is overbought : over 100
Type : Neutral
Timeframe : Daily
Williams %R indicator is overbought : over -20
Type : Neutral
Timeframe : Daily
Pivot points : price is over resistance 1
Type : Neutral
Timeframe : Weekly
Central Patterns, the market scanner focusing on chart patterns, resistances and supports found this result:
Near resistance of channel
Type : Bearish
Timeframe : Daily
The Central Candlesticks scanner, specialised in Japanese candlesticks, did not identify any signals.
| S3 | S2 | S1 | Price | R1 | R2 | R3 | |
|---|---|---|---|---|---|---|---|
| ProTrendLines | 30.854 | 32.049 | 33.181 | 33.891 | 35.055 | 36.567 | 38.814 |
| Change (%) | -8.96% | -5.44% | -2.09% | - | +3.43% | +7.90% | +14.53% |
| Change | -3.037 | -1.842 | -0.710 | - | +1.164 | +2.676 | +4.923 |
| Level | Intermediate | Major | Major | - | Major | Major | Intermediate |
Attention could also be paid to pivot points to set price objectives:
| Pivot points | S3 | S2 | S1 | PP | R1 | R2 | R3 |
|---|---|---|---|---|---|---|---|
| Standard | 33.126 | 33.336 | 33.614 | 33.824 | 34.102 | 34.312 | 34.590 |
| Camarilla | 33.759 | 33.804 | 33.848 | 33.893 | 33.938 | 33.983 | 34.027 |
| Woodie | 33.161 | 33.353 | 33.649 | 33.841 | 34.137 | 34.329 | 34.625 |
| Fibonacci | 33.336 | 33.522 | 33.637 | 33.824 | 34.010 | 34.125 | 34.312 |
| Pivot points | S3 | S2 | S1 | PP | R1 | R2 | R3 |
|---|---|---|---|---|---|---|---|
| Standard | 32.187 | 32.454 | 32.941 | 33.208 | 33.695 | 33.962 | 34.449 |
| Camarilla | 33.220 | 33.289 | 33.358 | 33.427 | 33.496 | 33.565 | 33.634 |
| Woodie | 32.296 | 32.509 | 33.050 | 33.263 | 33.804 | 34.017 | 34.558 |
| Fibonacci | 32.454 | 32.742 | 32.920 | 33.208 | 33.496 | 33.674 | 33.962 |
| Pivot points | S3 | S2 | S1 | PP | R1 | R2 | R3 |
|---|---|---|---|---|---|---|---|
| Standard | 29.569 | 31.145 | 32.107 | 33.683 | 34.645 | 36.221 | 37.183 |
| Camarilla | 32.370 | 32.603 | 32.835 | 33.068 | 33.301 | 33.533 | 33.766 |
| Woodie | 29.261 | 30.992 | 31.799 | 33.530 | 34.337 | 36.068 | 36.875 |
| Fibonacci | 31.145 | 32.115 | 32.714 | 33.683 | 34.653 | 35.252 | 36.221 |
Numerical data
The following is the status of the technical indicators and moving averages at the time of publication of this technical analysis:
| RSI (14): | 58.35 | |
| MACD (12,26,9): | -0.0040 | |
| Directional Movement: | 4.983 | |
| AROON (14): | 28.571 | |
| DEMA (21): | 33.478 | |
| Parabolic SAR (0,02-0,02-0,2): | 32.855 | |
| Elder Ray (13): | 0.426 | |
| Super Trend (3,10): | 34.098 | |
| Zig ZAG (10): | 33.930 | |
| VORTEX (21): | 0.9230 | |
| Stochastique (14,3,5): | 91.40 | |
| TEMA (21): | 33.380 | |
| Williams %R (14): | -7.09 | |
| Chande Momentum Oscillator (20): | 0.714 | |
| Repulse (5,40,3): | 1.6460 | |
| ROCnROLL: | 1 | |
| TRIX (15,9): | -0.0480 | |
| Courbe Coppock: | 0.20 |
| MA7: | 33.443 | |
| MA20: | 33.351 | |
| MA50: | 33.574 | |
| MA100: | 32.647 | |
| MAexp7: | 33.585 | |
| MAexp20: | 33.501 | |
| MAexp50: | 33.371 | |
| MAexp100: | 33.406 | |
| Price / MA7: | +1.34% | |
| Price / MA20: | +1.62% | |
| Price / MA50: | +0.94% | |
| Price / MA100: | +3.81% | |
| Price / MAexp7: | +0.90% | |
| Price / MAexp20: | +1.15% | |
| Price / MAexp50: | +1.55% | |
| Price / MAexp100: | +1.44% |
About author
Online


Add a comment
Comments
0 comments on the analysis NOK/HUF - Daily