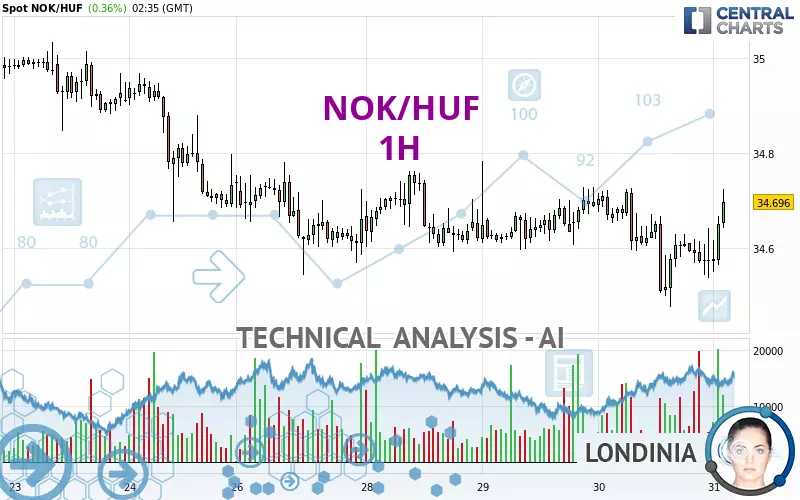
NOK/HUF - 1H - Technical analysis published on 01/31/2025 (GMT)
- 109
- 0
Click here for a new analysis!
- Timeframe : 1H
- - Analysis generated on
- Status : LEVEL MAINTAINED

Summary of the analysis

Additional analysis
Quotes
The NOK/HUF price is 34.699 HUF. The price registered an increase of +0.37% on the session with the lowest point at 34.549 HUF and the highest point at 34.723 HUF. The deviation from the price is +0.43% for the low point and -0.07% for the high point.Here is a more detailed summary of the historical variations registered by NOK/HUF:
Near a new HIGH record (1 year)
Type : Bullish
Timeframe : Weekly
Near a new HIGH record (1st january)
Type : Bullish
Timeframe : Weekly
Near a new HIGH record (1 month)
Type : Bullish
Timeframe : Weekly
Technical
Technical analysis of NOK/HUF in 1H shows an overall slightly bullish trend. 57.14% of the signals given by moving averages are bullish. The slightly bullish signals given by short-term moving averages do not show a strengthening of this global trend. The Central Indicators scanner detects bullish signals on moving averages that could impact this trend:
Bullish trend reversal : Moving Average 50
Type : Bullish
Timeframe : 1 hour
Bullish trend reversal : adaptative moving average 20
Type : Bullish
Timeframe : 1 hour
Bullish trend reversal : adaptative moving average 50
Type : Bullish
Timeframe : 1 hour
In fact, 13 technical indicators on 18 studied are currently positioned bullish. No additional result has been identified by Central Indicators, the scanner specialised in technical indicators.
The Central Patterns scanner, which studies chart patterns, resistances and supports, has identified these signals:
Near horizontal support
Type : Bullish
Timeframe : 1 hour
Support of channel is broken
Type : Bearish
Timeframe : 1 hour
The Central Candlesticks scanner which studies Japanese candlesticks did not detect anything.
| S3 | S2 | S1 | Price | R1 | R2 | R3 | |
|---|---|---|---|---|---|---|---|
| ProTrendLines | 34.475 | 34.543 | 34.594 | 34.699 | 34.727 | 34.853 | 34.967 |
| Change (%) | -0.65% | -0.45% | -0.30% | - | +0.08% | +0.44% | +0.77% |
| Change | -0.224 | -0.156 | -0.105 | - | +0.028 | +0.154 | +0.268 |
| Level | Minor | Intermediate | Major | - | Intermediate | Minor | Minor |
To determine price objectives, it is also possible to use the pivot points. Here is the price position in relation to pivot points:
| Pivot points | S3 | S2 | S1 | PP | R1 | R2 | R3 |
|---|---|---|---|---|---|---|---|
| Standard | 34.204 | 34.339 | 34.456 | 34.591 | 34.708 | 34.843 | 34.960 |
| Camarilla | 34.503 | 34.526 | 34.549 | 34.572 | 34.595 | 34.618 | 34.641 |
| Woodie | 34.194 | 34.335 | 34.446 | 34.587 | 34.698 | 34.839 | 34.950 |
| Fibonacci | 34.339 | 34.436 | 34.495 | 34.591 | 34.688 | 34.747 | 34.843 |
| Pivot points | S3 | S2 | S1 | PP | R1 | R2 | R3 |
|---|---|---|---|---|---|---|---|
| Standard | 33.909 | 34.282 | 34.507 | 34.880 | 35.105 | 35.478 | 35.703 |
| Camarilla | 34.569 | 34.623 | 34.678 | 34.733 | 34.788 | 34.843 | 34.898 |
| Woodie | 33.836 | 34.245 | 34.434 | 34.843 | 35.032 | 35.441 | 35.630 |
| Fibonacci | 34.282 | 34.510 | 34.651 | 34.880 | 35.108 | 35.249 | 35.478 |
| Pivot points | S3 | S2 | S1 | PP | R1 | R2 | R3 |
|---|---|---|---|---|---|---|---|
| Standard | 33.158 | 33.849 | 34.383 | 35.074 | 35.608 | 36.299 | 36.833 |
| Camarilla | 34.580 | 34.692 | 34.805 | 34.917 | 35.029 | 35.142 | 35.254 |
| Woodie | 33.080 | 33.810 | 34.305 | 35.035 | 35.530 | 36.260 | 36.755 |
| Fibonacci | 33.849 | 34.317 | 34.606 | 35.074 | 35.542 | 35.831 | 36.299 |
Numerical data
The following is the status of technical indicators and moving averages registered at the time this technical analysis was created:
| RSI (14): | 61.38 | |
| MACD (12,26,9): | -0.0050 | |
| Directional Movement: | 6.853 | |
| AROON (14): | 78.571 | |
| DEMA (21): | 34.603 | |
| Parabolic SAR (0,02-0,02-0,2): | 34.489 | |
| Elder Ray (13): | 0.070 | |
| Super Trend (3,10): | 34.736 | |
| Zig ZAG (10): | 34.695 | |
| VORTEX (21): | 0.9870 | |
| Stochastique (14,3,5): | 77.14 | |
| TEMA (21): | 34.608 | |
| Williams %R (14): | -9.68 | |
| Chande Momentum Oscillator (20): | 0.178 | |
| Repulse (5,40,3): | 0.2900 | |
| ROCnROLL: | 1 | |
| TRIX (15,9): | -0.0070 | |
| Courbe Coppock: | 0.00 |
| MA7: | 34.698 | |
| MA20: | 35.022 | |
| MA50: | 35.097 | |
| MA100: | 34.604 | |
| MAexp7: | 34.622 | |
| MAexp20: | 34.614 | |
| MAexp50: | 34.633 | |
| MAexp100: | 34.677 | |
| Price / MA7: | +0.00% | |
| Price / MA20: | -0.92% | |
| Price / MA50: | -1.13% | |
| Price / MA100: | +0.27% | |
| Price / MAexp7: | +0.23% | |
| Price / MAexp20: | +0.25% | |
| Price / MAexp50: | +0.20% | |
| Price / MAexp100: | +0.07% |
About author
Online


Add a comment
Comments
0 comments on the analysis NOK/HUF - 1H