| Open: | - |
| Change: | - |
| Volume: | - |
| Low: | - |
| High: | - |
| High / Low range: | - |
| Type: | Forex |
| Ticker: | NOKHKD |
| ISIN: |
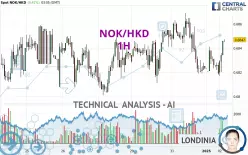
NOK/HKD - 1H - Technical analysis published on 01/02/2025 (GMT)
- 90
- 0
- 01/02/2025 - 03:05
Click here for a new analysis!
- Timeframe : 1H
- - Analysis generated on 01/02/2025 - 03:05
- Status : INVALID

Summary of the analysis

Additional analysis
Quotes
NOK/HKD rating 0.6847 HKD. The price registered an increase of +0.41% on the session and was between 0.6817 HKD and 0.6847 HKD. This implies that the price is at +0.44% from its lowest and at 0% from its highest.A study of price movements over other periods shows the following variations:
Near a new LOW record (1 year)
Type : Bearish
Timeframe : Weekly
Near a new HIGH record (1st january)
Type : Bullish
Timeframe : Weekly
Near a new HIGH record (1 month)
Type : Bullish
Timeframe : Weekly
Technical
A technical analysis in 1H of this NOK/HKD chart shows a slightly bullish trend. 60.71% of the signals given by moving averages are bullish. The slightly bullish signals given by short-term moving averages do not show a strengthening of this global trend. An assessment of moving averages reveals several bullish signals that could impact this trend:
Bullish trend reversal : Moving Average 100
Type : Bullish
Timeframe : 1 hour
Bullish trend reversal : adaptative moving average 20
Type : Bullish
Timeframe : 1 hour
Bullish price crossover with Moving Average 50
Type : Bullish
Timeframe : 1 hour
The technical indicators are bullish. There is still some doubt about the price increase.
Central Indicators, the scanner specialised in technical indicators, has identified these signals:
Pivot points : price is over resistance 1
Type : Neutral
Timeframe : 1 hour
Price is back over the pivot point
Type : Bullish
Timeframe : Weekly
Central Patterns, the scanner specializing in chart patterns, did not identify any signals.
The Central Candlesticks scanner which studies Japanese candlesticks did not detect anything.
| S3 | S2 | S1 | Price | R1 | R2 | R3 | |
|---|---|---|---|---|---|---|---|
| ProTrendLines | 0.6812 | 0.6827 | 0.6841 | 0.6847 | 0.6852 | 0.6869 | 0.6882 |
| Change (%) | -0.51% | -0.29% | -0.09% | - | +0.07% | +0.32% | +0.51% |
| Change | -0.0035 | -0.0020 | -0.0006 | - | +0.0005 | +0.0022 | +0.0035 |
| Level | Major | Minor | Intermediate | - | Intermediate | Minor | Minor |
Attention could also be paid to pivot points to set price objectives:
| Pivot points | S3 | S2 | S1 | PP | R1 | R2 | R3 |
|---|---|---|---|---|---|---|---|
| Standard | 0.6788 | 0.6803 | 0.6811 | 0.6826 | 0.6834 | 0.6849 | 0.6857 |
| Camarilla | 0.6813 | 0.6815 | 0.6817 | 0.6819 | 0.6821 | 0.6823 | 0.6825 |
| Woodie | 0.6785 | 0.6801 | 0.6808 | 0.6824 | 0.6831 | 0.6847 | 0.6854 |
| Fibonacci | 0.6803 | 0.6812 | 0.6817 | 0.6826 | 0.6835 | 0.6840 | 0.6849 |
| Pivot points | S3 | S2 | S1 | PP | R1 | R2 | R3 |
|---|---|---|---|---|---|---|---|
| Standard | 0.6715 | 0.6758 | 0.6796 | 0.6839 | 0.6877 | 0.6920 | 0.6958 |
| Camarilla | 0.6812 | 0.6819 | 0.6827 | 0.6834 | 0.6841 | 0.6849 | 0.6856 |
| Woodie | 0.6713 | 0.6757 | 0.6794 | 0.6838 | 0.6875 | 0.6919 | 0.6956 |
| Fibonacci | 0.6758 | 0.6789 | 0.6808 | 0.6839 | 0.6870 | 0.6889 | 0.6920 |
| Pivot points | S3 | S2 | S1 | PP | R1 | R2 | R3 |
|---|---|---|---|---|---|---|---|
| Standard | 0.6408 | 0.6589 | 0.6706 | 0.6887 | 0.7004 | 0.7185 | 0.7302 |
| Camarilla | 0.6741 | 0.6768 | 0.6796 | 0.6823 | 0.6850 | 0.6878 | 0.6905 |
| Woodie | 0.6376 | 0.6573 | 0.6674 | 0.6871 | 0.6972 | 0.7169 | 0.7270 |
| Fibonacci | 0.6589 | 0.6703 | 0.6773 | 0.6887 | 0.7001 | 0.7071 | 0.7185 |
Numerical data
The following is the status of the technical indicators and moving averages at the time of publication of this technical analysis:
| RSI (14): | 52.95 | |
| MACD (12,26,9): | -0.0003 | |
| Directional Movement: | 7.5075 | |
| AROON (14): | -50.0000 | |
| DEMA (21): | 0.6827 | |
| Parabolic SAR (0,02-0,02-0,2): | 0.6839 | |
| Elder Ray (13): | 0.0006 | |
| Super Trend (3,10): | 0.6846 | |
| Zig ZAG (10): | 0.6836 | |
| VORTEX (21): | 0.9947 | |
| Stochastique (14,3,5): | 68.06 | |
| TEMA (21): | 0.6827 | |
| Williams %R (14): | -16.67 | |
| Chande Momentum Oscillator (20): | 0.0014 | |
| Repulse (5,40,3): | 0.2084 | |
| ROCnROLL: | 1 | |
| TRIX (15,9): | -0.0097 | |
| Courbe Coppock: | 0.08 |
| MA7: | 0.6832 | |
| MA20: | 0.6898 | |
| MA50: | 0.6989 | |
| MA100: | 0.7147 | |
| MAexp7: | 0.6831 | |
| MAexp20: | 0.6831 | |
| MAexp50: | 0.6835 | |
| MAexp100: | 0.6836 | |
| Price / MA7: | +0.22% | |
| Price / MA20: | -0.74% | |
| Price / MA50: | -2.03% | |
| Price / MA100: | -4.20% | |
| Price / MAexp7: | +0.23% | |
| Price / MAexp20: | +0.23% | |
| Price / MAexp50: | +0.18% | |
| Price / MAexp100: | +0.16% |
About author
Online


Add a comment
Comments
0 comments on the analysis NOK/HKD - 1H