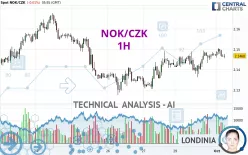
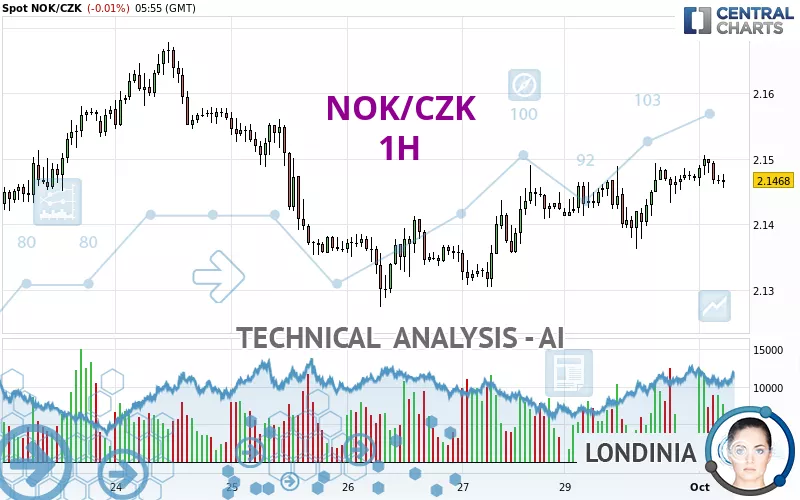
NOK/CZK - 1H - Technical analysis published on 10/01/2024 (GMT)
- 89
- 0
Click here for a new analysis!
- Timeframe : 1H
- - Analysis generated on
- Status : TARGET REACHED
Summary of the analysis

Additional analysis
Quotes
The NOK/CZK price is 2.1467 CZK. The price registered a decrease of -0.02% on the session and was traded between 2.1456 CZK and 2.1505 CZK over the period. The price is currently at +0.05% from its lowest and -0.18% from its highest.A study of price movements over other periods shows the following variations:
Near a new HIGH record (1 year)
Type : Bullish
Timeframe : Weekly
Near a new HIGH record (1st january)
Type : Bullish
Timeframe : Weekly
Near a new LOW record (1 month)
Type : Bearish
Timeframe : Weekly
Technical
Technical analysis of NOK/CZK in 1H shows a strongly overall bullish trend. 82.14% of the signals given by moving averages are bullish. The overall trend is supported by the strong bullish signals from short-term moving averages. The Central Indicators scanner detects bearish signals on moving averages that could impact this trend:
Bearish price crossover with Moving Average 20
Type : Bearish
Timeframe : 1 hour
Bearish price crossover with adaptative moving average 100
Type : Bearish
Timeframe : 1 hour
An assessment of technical indicators shows a slightly bullish signal.
No additional result has been identified by Central Indicators, the scanner specialised in technical indicators.
An analysis of the price chart with the Central Patterns scanner (detector of chart patterns and resistances and supports) shows several results that can have an impact on the price change:
Near resistance of channel
Type : Bearish
Timeframe : 1 hour
Near resistance of triangle
Type : Bearish
Timeframe : 1 hour
The Central Candlesticks scanner which studies Japanese candlesticks did not detect anything.
| S3 | S2 | S1 | Price | R1 | R2 | R3 | |
|---|---|---|---|---|---|---|---|
| ProTrendLines | 2.1303 | 2.1364 | 2.1412 | 2.1467 | 2.1491 | 2.1575 | 2.1646 |
| Change (%) | -0.76% | -0.48% | -0.26% | - | +0.11% | +0.50% | +0.83% |
| Change | -0.0164 | -0.0103 | -0.0055 | - | +0.0024 | +0.0108 | +0.0179 |
| Level | Intermediate | Intermediate | Minor | - | Major | Major | Minor |
Attention could also be paid to pivot points to set price objectives:
| Pivot points | S3 | S2 | S1 | PP | R1 | R2 | R3 |
|---|---|---|---|---|---|---|---|
| Standard | 2.1262 | 2.1312 | 2.1392 | 2.1442 | 2.1522 | 2.1572 | 2.1652 |
| Camarilla | 2.1435 | 2.1447 | 2.1459 | 2.1471 | 2.1483 | 2.1495 | 2.1507 |
| Woodie | 2.1276 | 2.1320 | 2.1406 | 2.1450 | 2.1536 | 2.1580 | 2.1666 |
| Fibonacci | 2.1312 | 2.1362 | 2.1393 | 2.1442 | 2.1492 | 2.1523 | 2.1572 |
| Pivot points | S3 | S2 | S1 | PP | R1 | R2 | R3 |
|---|---|---|---|---|---|---|---|
| Standard | 2.0835 | 2.1054 | 2.1239 | 2.1458 | 2.1643 | 2.1862 | 2.2047 |
| Camarilla | 2.1312 | 2.1349 | 2.1386 | 2.1423 | 2.1460 | 2.1497 | 2.1534 |
| Woodie | 2.0817 | 2.1046 | 2.1221 | 2.1450 | 2.1625 | 2.1854 | 2.2029 |
| Fibonacci | 2.1054 | 2.1209 | 2.1304 | 2.1458 | 2.1613 | 2.1708 | 2.1862 |
| Pivot points | S3 | S2 | S1 | PP | R1 | R2 | R3 |
|---|---|---|---|---|---|---|---|
| Standard | 1.9996 | 2.0438 | 2.0954 | 2.1396 | 2.1912 | 2.2354 | 2.2870 |
| Camarilla | 2.1208 | 2.1295 | 2.1383 | 2.1471 | 2.1559 | 2.1647 | 2.1735 |
| Woodie | 2.0034 | 2.0457 | 2.0992 | 2.1415 | 2.1950 | 2.2373 | 2.2908 |
| Fibonacci | 2.0438 | 2.0804 | 2.1030 | 2.1396 | 2.1762 | 2.1988 | 2.2354 |
Numerical data
The following are the details of the technical indicators and moving averages that were collected to generate this technical analysis:
| RSI (14): | 53.97 | |
| MACD (12,26,9): | 0.0016 | |
| Directional Movement: | 4.5565 | |
| AROON (14): | 85.7143 | |
| DEMA (21): | 2.1484 | |
| Parabolic SAR (0,02-0,02-0,2): | 2.1396 | |
| Elder Ray (13): | 0.0007 | |
| Super Trend (3,10): | 2.1404 | |
| Zig ZAG (10): | 2.1470 | |
| VORTEX (21): | 1.0520 | |
| Stochastique (14,3,5): | 82.73 | |
| TEMA (21): | 2.1489 | |
| Williams %R (14): | -36.96 | |
| Chande Momentum Oscillator (20): | 0.0003 | |
| Repulse (5,40,3): | -0.0591 | |
| ROCnROLL: | -1 | |
| TRIX (15,9): | 0.0101 | |
| Courbe Coppock: | 0.48 |
| MA7: | 2.1460 | |
| MA20: | 2.1294 | |
| MA50: | 2.1325 | |
| MA100: | 2.1483 | |
| MAexp7: | 2.1479 | |
| MAexp20: | 2.1462 | |
| MAexp50: | 2.1440 | |
| MAexp100: | 2.1433 | |
| Price / MA7: | +0.03% | |
| Price / MA20: | +0.81% | |
| Price / MA50: | +0.67% | |
| Price / MA100: | -0.07% | |
| Price / MAexp7: | -0.05% | |
| Price / MAexp20: | +0.03% | |
| Price / MAexp50: | +0.13% | |
| Price / MAexp100: | +0.16% |
About author
Online


Add a comment
Comments
0 comments on the analysis NOK/CZK - 1H