TEUCRIUM WHEAT FUND ETV - Daily - Technical analysis published on 10/21/2022 (GMT)
- 127
- 0
Click here for a new analysis!
- Timeframe : Daily
- - Analysis generated on
- Status : INVALID
Summary of the analysis

Additional analysis
Quotes
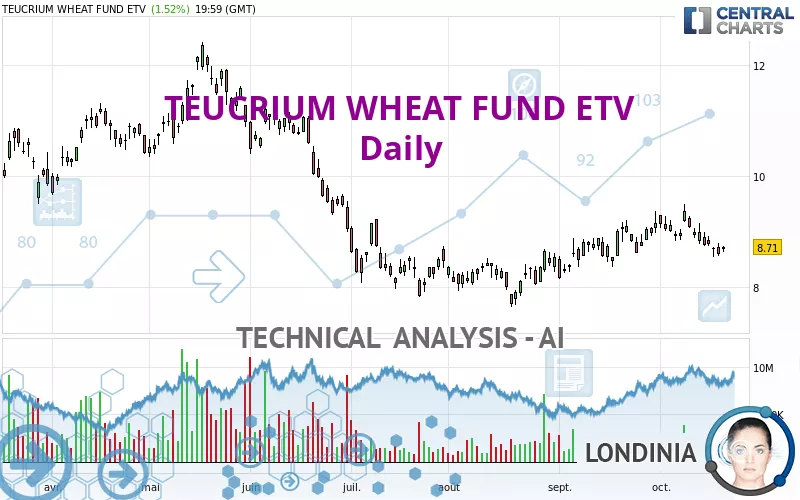
The TEUCRIUM WHEAT FUND ETV rating is 8.71 USD. The price registered an increase of +1.52% on the session and was between 8.62 USD and 8.73 USD. This implies that the price is at +1.04% from its lowest and at -0.23% from its highest.The Central Gaps scanner detects a bullish opening. A small advantage for buyers in the very short term.
Bullish opening
Type : Bullish
Timeframe : Openning
So that you have an overall view of the price change, here is a table showing the variations over several periods:
Near a new LOW record (1 month)
Type : Bearish
Timeframe : Weekly
Technical
Technical analysis of TEUCRIUM WHEAT FUND ETV in Daily shows an overall bearish trend. The signals given by moving averages are at 71.43% bearish. This bearish trend shows slight signs of slowing down given the slightly bearish signals of short-term moving averages. The Central Indicators market scanner is currently detecting several bullish signals that could impact this trend:
Bullish price crossover with Moving Average 50
Type : Bullish
Timeframe : Daily
Bullish price crossover with adaptative moving average 20
Type : Bullish
Timeframe : Daily
Bullish price crossover with adaptative moving average 50
Type : Bullish
Timeframe : Daily
In fact, only 8 technical indicators out of 18 studied are currently positioned bearish. Caution: the Central Indicators scanner currently detects an excess:
CCI indicator is oversold : under -100
Type : Neutral
Timeframe : Daily
Williams %R indicator is oversold : under -80
Type : Neutral
Timeframe : Daily
Ichimoku : price is over the cloud
Type : Bullish
Timeframe : Daily
Central Patterns, the market scanner focusing on chart patterns, resistances and supports found this result:
Near resistance of triangle
Type : Bearish
Timeframe : Daily
No result was found by the Central Candlesticks scanner on Japanese candlesticks.
| S3 | S2 | S1 | Price | R1 | R2 | R3 | |
|---|---|---|---|---|---|---|---|
| ProTrendLines | 7.25 | 7.71 | 8.29 | 8.71 | 9.69 | 10.69 | 11.17 |
| Change (%) | -16.76% | -11.48% | -4.82% | - | +11.25% | +22.73% | +28.24% |
| Change | -1.46 | -1.00 | -0.42 | - | +0.98 | +1.98 | +2.46 |
| Level | Minor | Major | Major | - | Intermediate | Minor | Minor |
Attention could also be paid to pivot points to set price objectives:
| Pivot points | S3 | S2 | S1 | PP | R1 | R2 | R3 |
|---|---|---|---|---|---|---|---|
| Standard | 8.53 | 8.58 | 8.64 | 8.69 | 8.75 | 8.80 | 8.86 |
| Camarilla | 8.68 | 8.69 | 8.70 | 8.71 | 8.72 | 8.73 | 8.74 |
| Woodie | 8.55 | 8.58 | 8.66 | 8.69 | 8.77 | 8.80 | 8.88 |
| Fibonacci | 8.58 | 8.62 | 8.65 | 8.69 | 8.73 | 8.76 | 8.80 |
| Pivot points | S3 | S2 | S1 | PP | R1 | R2 | R3 |
|---|---|---|---|---|---|---|---|
| Standard | 7.72 | 8.22 | 8.49 | 8.99 | 9.26 | 9.76 | 10.03 |
| Camarilla | 8.54 | 8.61 | 8.68 | 8.75 | 8.82 | 8.89 | 8.96 |
| Woodie | 7.60 | 8.16 | 8.37 | 8.93 | 9.14 | 9.70 | 9.91 |
| Fibonacci | 8.22 | 8.52 | 8.70 | 8.99 | 9.29 | 9.47 | 9.76 |
| Pivot points | S3 | S2 | S1 | PP | R1 | R2 | R3 |
|---|---|---|---|---|---|---|---|
| Standard | 7.17 | 7.65 | 8.40 | 8.88 | 9.63 | 10.11 | 10.86 |
| Camarilla | 8.81 | 8.93 | 9.04 | 9.15 | 9.26 | 9.38 | 9.49 |
| Woodie | 7.31 | 7.72 | 8.54 | 8.95 | 9.77 | 10.18 | 11.00 |
| Fibonacci | 7.65 | 8.12 | 8.41 | 8.88 | 9.35 | 9.64 | 10.11 |
Numerical data
The following is the status of technical indicators and moving averages registered at the time this technical analysis was created:
| RSI (14): | 47.22 | |
| MACD (12,26,9): | 0.0000 | |
| Directional Movement: | 2.67 | |
| AROON (14): | -42.85 | |
| DEMA (21): | 8.88 | |
| Parabolic SAR (0,02-0,02-0,2): | 9.32 | |
| Elder Ray (13): | -0.16 | |
| Super Trend (3,10): | 8.38 | |
| Zig ZAG (10): | 8.71 | |
| VORTEX (21): | 0.8200 | |
| Stochastique (14,3,5): | 12.71 | |
| TEMA (21): | 8.80 | |
| Williams %R (14): | -81.44 | |
| Chande Momentum Oscillator (20): | -0.33 | |
| Repulse (5,40,3): | -1.4900 | |
| ROCnROLL: | 2 | |
| TRIX (15,9): | 0.1300 | |
| Courbe Coppock: | 4.19 |
| MA7: | 8.77 | |
| MA20: | 8.91 | |
| MA50: | 8.64 | |
| MA100: | 8.94 | |
| MAexp7: | 8.76 | |
| MAexp20: | 8.84 | |
| MAexp50: | 8.80 | |
| MAexp100: | 8.93 | |
| Price / MA7: | -0.68% | |
| Price / MA20: | -2.24% | |
| Price / MA50: | +0.81% | |
| Price / MA100: | -2.57% | |
| Price / MAexp7: | -0.57% | |
| Price / MAexp20: | -1.47% | |
| Price / MAexp50: | -1.02% | |
| Price / MAexp100: | -2.46% |
About author

Online


Add a comment
Comments
0 comments on the analysis TEUCRIUM WHEAT FUND ETV - Daily