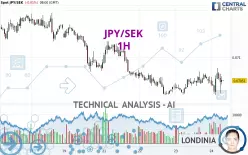
JPY/SEK - 1H - Technical analysis published on 01/24/2025 (GMT)
- 125
- 0
Click here for a new analysis!
- Timeframe : 1H
- - Analysis generated on
- Status : TARGET REACHED

Summary of the analysis

Additional analysis
Quotes
JPY/SEK rating 0.07051 SEK. The price is lower by -0.01% since the last closing and was between 0.07020 SEK and 0.07078 SEK. This implies that the price is at +0.44% from its lowest and at -0.38% from its highest.A study of price movements over other periods shows the following variations:
Near a new HIGH record (1st january)
Type : Bullish
Timeframe : Weekly
Near a new HIGH record (1 month)
Type : Bullish
Timeframe : Weekly
Technical
Technical analysis of this 1H chart of JPY/SEK indicates that the overall trend is bearish. 64.29% of the signals given by moving averages are bearish. Caution: the neutral signals currently given by short-term moving averages show us that the global trend is losing momentum. The Central Indicators scanner detects bullish and bearish signals on moving averages that could impact this trend:
Bearish trend reversal : adaptative moving average 20
Type : Bearish
Timeframe : 1 hour
Bullish price crossover with Moving Average 20
Type : Bullish
Timeframe : 1 hour
Bearish price crossover with Moving Average 50
Type : Bearish
Timeframe : 1 hour
Bullish price crossover with adaptative moving average 50
Type : Bullish
Timeframe : 1 hour
An assessment of technical indicators does not currently provide any relevant information on the direction of future price movements.
Central Indicators, the scanner specialised in technical indicators, has identified these signals:
Pivot points : price is under support 1
Type : Neutral
Timeframe : Weekly
Price is back under the pivot point
Type : Bearish
Timeframe : 1 hour
The Central Patterns scanner, which studies chart patterns, resistances and supports, has identified this signal:
Near resistance of channel
Type : Bearish
Timeframe : 1 hour
The Central Candlesticks scanner, specialised in Japanese candlesticks, did not identify any signals.
| S3 | S2 | S1 | Price | R1 | R2 | R3 | |
|---|---|---|---|---|---|---|---|
| ProTrendLines | 0.06971 | 0.07020 | 0.07040 | 0.07051 | 0.07066 | 0.07098 | 0.07129 |
| Change (%) | -1.13% | -0.44% | -0.16% | - | +0.21% | +0.67% | +1.11% |
| Change | -0.00080 | -0.00031 | -0.00011 | - | +0.00015 | +0.00047 | +0.00078 |
| Level | Major | Major | Minor | - | Major | Minor | Major |
Pivot points can also be used to set your price objectives. Here is the price situation in relation to pivot points:
| Pivot points | S3 | S2 | S1 | PP | R1 | R2 | R3 |
|---|---|---|---|---|---|---|---|
| Standard | 0.06976 | 0.06999 | 0.07025 | 0.07048 | 0.07074 | 0.07097 | 0.07123 |
| Camarilla | 0.07039 | 0.07043 | 0.07048 | 0.07052 | 0.07057 | 0.07061 | 0.07066 |
| Woodie | 0.06979 | 0.07000 | 0.07028 | 0.07049 | 0.07077 | 0.07098 | 0.07126 |
| Fibonacci | 0.06999 | 0.07017 | 0.07029 | 0.07048 | 0.07066 | 0.07078 | 0.07097 |
| Pivot points | S3 | S2 | S1 | PP | R1 | R2 | R3 |
|---|---|---|---|---|---|---|---|
| Standard | 0.06956 | 0.07011 | 0.07087 | 0.07142 | 0.07218 | 0.07273 | 0.07349 |
| Camarilla | 0.07127 | 0.07139 | 0.07151 | 0.07163 | 0.07175 | 0.07187 | 0.07199 |
| Woodie | 0.06967 | 0.07016 | 0.07098 | 0.07147 | 0.07229 | 0.07278 | 0.07360 |
| Fibonacci | 0.07011 | 0.07061 | 0.07092 | 0.07142 | 0.07192 | 0.07223 | 0.07273 |
| Pivot points | S3 | S2 | S1 | PP | R1 | R2 | R3 |
|---|---|---|---|---|---|---|---|
| Standard | 0.06394 | 0.06671 | 0.06856 | 0.07133 | 0.07318 | 0.07595 | 0.07780 |
| Camarilla | 0.06915 | 0.06957 | 0.07000 | 0.07042 | 0.07084 | 0.07127 | 0.07169 |
| Woodie | 0.06349 | 0.06648 | 0.06811 | 0.07110 | 0.07273 | 0.07572 | 0.07735 |
| Fibonacci | 0.06671 | 0.06847 | 0.06956 | 0.07133 | 0.07309 | 0.07418 | 0.07595 |
Numerical data
The following is the status of the technical indicators and moving averages at the time of publication of this technical analysis:
| RSI (14): | 50.00 | |
| MACD (12,26,9): | 0.0000 | |
| Directional Movement: | -3.47566 | |
| AROON (14): | 7.14286 | |
| DEMA (21): | 0.07050 | |
| Parabolic SAR (0,02-0,02-0,2): | 0.07022 | |
| Elder Ray (13): | -0.00001 | |
| Super Trend (3,10): | 0.07025 | |
| Zig ZAG (10): | 0.07047 | |
| VORTEX (21): | 0.9881 | |
| Stochastique (14,3,5): | 51.72 | |
| TEMA (21): | 0.07053 | |
| Williams %R (14): | -56.90 | |
| Chande Momentum Oscillator (20): | -0.00019 | |
| Repulse (5,40,3): | -0.0889 | |
| ROCnROLL: | 2 | |
| TRIX (15,9): | 0.0039 | |
| Courbe Coppock: | 0.06 |
| MA7: | 0.07089 | |
| MA20: | 0.07071 | |
| MA50: | 0.07123 | |
| MA100: | 0.07092 | |
| MAexp7: | 0.07050 | |
| MAexp20: | 0.07049 | |
| MAexp50: | 0.07053 | |
| MAexp100: | 0.07069 | |
| Price / MA7: | -0.54% | |
| Price / MA20: | -0.28% | |
| Price / MA50: | -1.01% | |
| Price / MA100: | -0.58% | |
| Price / MAexp7: | +0.01% | |
| Price / MAexp20: | +0.03% | |
| Price / MAexp50: | -0.03% | |
| Price / MAexp100: | -0.25% |
About author
Online


Add a comment
Comments
0 comments on the analysis JPY/SEK - 1H