ISHARES IBOXX HIGH YIELD - Daily - Technical analysis published on 12/14/2024 (GMT)
- 88
- 0
Click here for a new analysis!
- Timeframe : Daily
- - Analysis generated on
- Status : INVALID
Summary of the analysis

Additional analysis
Quotes
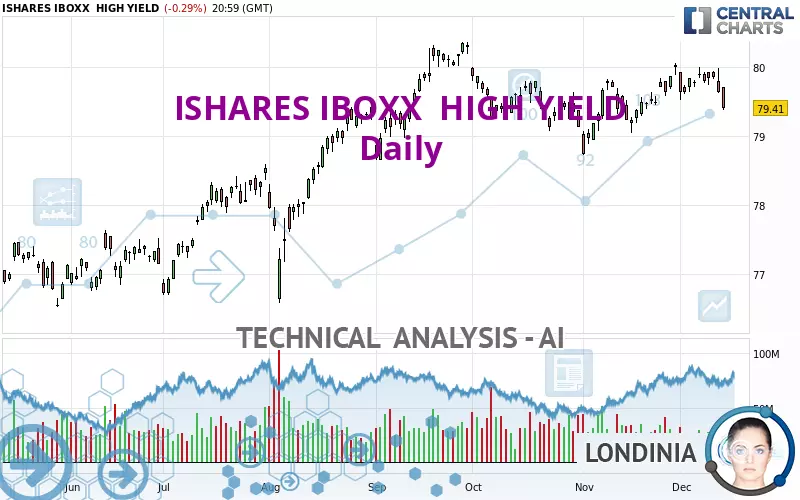
The ISHARES IBOXX HIGH YIELD rating is 79.41 USD. The price registered a decrease of -0.29% on the session and was traded between 79.38 USD and 79.71 USD over the period. The price is currently at +0.04% from its lowest and -0.38% from its highest.A bullish opening was detected by the Central Gaps scanner. Buyers are trying to impose a bullish momentum in the very short term.
Bullish opening
Type : Bullish
Timeframe : Openning
So that you have an overall view of the price change, here is a table showing the variations over several periods:
Near a new HIGH record (1 year)
Type : Bullish
Timeframe : Weekly
Near a new HIGH record (1st january)
Type : Bullish
Timeframe : Weekly
Near a new LOW record (1 month)
Type : Bearish
Timeframe : Weekly
Technical
Technical analysis of ISHARES IBOXX HIGH YIELD in Daily shows an overall bullish trend. 75.00% of the signals given by moving averages are bullish. Caution: the neutral signals currently given by short-term moving averages show us that the global trend is losing momentum. The Central Indicators scanner detects bearish signals on moving averages that could impact this trend:
Bearish price crossover with Moving Average 20
Type : Bearish
Timeframe : Daily
Bearish price crossover with adaptative moving average 20
Type : Bearish
Timeframe : Daily
In fact, of the 18 technical indicators analysed by Central Analyzer, 4 are bullish, 11 are neutral and 3 are bearish. Central Indicators, the scanner specialised in technical indicators, has identified these signals:
Pivot points : price is under support 1
Type : Neutral
Timeframe : Daily
Pivot points : price is under support 1
Type : Neutral
Timeframe : Weekly
RSI indicator is back under 50
Type : Bearish
Timeframe : Daily
MACD crosses DOWN its Moving Average
Type : Bearish
Timeframe : Daily
Williams %R indicator is back under -50
Type : Bearish
Timeframe : Daily
An analysis of the price chart with the Central Patterns scanner (detector of chart patterns and resistances and supports) shows a result that can have an impact on the price change:
Near horizontal resistance
Type : Bearish
Timeframe : Daily
The Central Candlesticks scanner which studies Japanese candlesticks did not detect anything.
| S3 | S2 | S1 | Price | R1 | R2 | R3 | |
|---|---|---|---|---|---|---|---|
| ProTrendLines | 75.25 | 76.78 | 78.29 | 79.41 | 79.60 | 83.62 | 85.27 |
| Change (%) | -5.24% | -3.31% | -1.41% | - | +0.24% | +5.30% | +7.38% |
| Change | -4.16 | -2.63 | -1.12 | - | +0.19 | +4.21 | +5.86 |
| Level | Major | Minor | Major | - | Major | Minor | Major |
Attention could also be paid to pivot points to set price objectives:
| Pivot points | S3 | S2 | S1 | PP | R1 | R2 | R3 |
|---|---|---|---|---|---|---|---|
| Standard | 78.96 | 79.17 | 79.29 | 79.50 | 79.62 | 79.83 | 79.95 |
| Camarilla | 79.32 | 79.35 | 79.38 | 79.41 | 79.44 | 79.47 | 79.50 |
| Woodie | 78.92 | 79.15 | 79.25 | 79.48 | 79.58 | 79.81 | 79.91 |
| Fibonacci | 79.17 | 79.30 | 79.37 | 79.50 | 79.63 | 79.70 | 79.83 |
| Pivot points | S3 | S2 | S1 | PP | R1 | R2 | R3 |
|---|---|---|---|---|---|---|---|
| Standard | 78.59 | 78.98 | 79.20 | 79.59 | 79.81 | 80.20 | 80.42 |
| Camarilla | 79.24 | 79.30 | 79.35 | 79.41 | 79.47 | 79.52 | 79.58 |
| Woodie | 78.50 | 78.94 | 79.11 | 79.55 | 79.72 | 80.16 | 80.33 |
| Fibonacci | 78.98 | 79.22 | 79.36 | 79.59 | 79.83 | 79.97 | 80.20 |
| Pivot points | S3 | S2 | S1 | PP | R1 | R2 | R3 |
|---|---|---|---|---|---|---|---|
| Standard | 77.47 | 77.93 | 78.80 | 79.26 | 80.13 | 80.59 | 81.46 |
| Camarilla | 79.31 | 79.44 | 79.56 | 79.68 | 79.80 | 79.92 | 80.05 |
| Woodie | 77.69 | 78.03 | 79.02 | 79.36 | 80.35 | 80.69 | 81.68 |
| Fibonacci | 77.93 | 78.44 | 78.75 | 79.26 | 79.77 | 80.08 | 80.59 |
Numerical data
The following are the details of the technical indicators and moving averages that were collected to generate this technical analysis:
| RSI (14): | 48.67 | |
| MACD (12,26,9): | 0.1600 | |
| Directional Movement: | -1.47 | |
| AROON (14): | 64.29 | |
| DEMA (21): | 79.75 | |
| Parabolic SAR (0,02-0,02-0,2): | 79.99 | |
| Elder Ray (13): | -0.08 | |
| Super Trend (3,10): | 79.27 | |
| Zig ZAG (10): | 79.41 | |
| VORTEX (21): | 0.9900 | |
| Stochastique (14,3,5): | 56.57 | |
| TEMA (21): | 79.79 | |
| Williams %R (14): | -75.35 | |
| Chande Momentum Oscillator (20): | 0.13 | |
| Repulse (5,40,3): | -0.8700 | |
| ROCnROLL: | -1 | |
| TRIX (15,9): | 0.0300 | |
| Courbe Coppock: | 1.40 |
| MA7: | 79.75 | |
| MA20: | 79.49 | |
| MA50: | 79.23 | |
| MA100: | 78.66 | |
| MAexp7: | 79.66 | |
| MAexp20: | 79.53 | |
| MAexp50: | 79.21 | |
| MAexp100: | 78.53 | |
| Price / MA7: | -0.43% | |
| Price / MA20: | -0.10% | |
| Price / MA50: | +0.23% | |
| Price / MA100: | +0.95% | |
| Price / MAexp7: | -0.31% | |
| Price / MAexp20: | -0.15% | |
| Price / MAexp50: | +0.25% | |
| Price / MAexp100: | +1.12% |
About author

Online


Add a comment
Comments
0 comments on the analysis ISHARES IBOXX HIGH YIELD - Daily