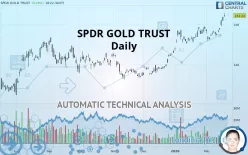
SPDR GOLD TRUST - Daily - Technical analysis published on 02/20/2020 (GMT)
- 314
- 0
- Who voted?
Click here for a new analysis!
- Timeframe : Daily
- - Analysis generated on
- Status : INVALID

Summary of the analysis

Additional analysis
Quotes
The SPDR GOLD TRUST price is 152.23 USD. The price registered an increase of +0.29% on the session with the lowest point at 151.95 USD and the highest point at 152.83 USD. The deviation from the price is +0.18% for the low point and -0.39% for the high point.The Central Gaps scanner detects a bullish gap which is a sign that buyers have taken the lead in the very short term.
Opening Gap UP
Type : Bullish
Timeframe : Openning
Here is a more detailed summary of the historical variations registered by SPDR GOLD TRUST:
New HIGH record (5 years)
Type : Bullish
Timeframe : Weekly
New HIGH record (1 year)
Type : Bullish
Timeframe : Weekly
New HIGH record (1st january)
Type : Bullish
Timeframe : Weekly
New HIGH record (1 month)
Type : Bullish
Timeframe : Weekly
Technical
Technical analysis of SPDR GOLD TRUST in Daily shows a strongly overall bullish trend. The signals given by the moving averages are 92.86% bullish. This strong bullish trend is confirmed by the strong signals currently being given by short-term moving averages. The Central Indicators scanner does not detect any result on moving averages that would impact this trend.
An assessment of technical indicators shows a strong bullish signal.
Caution: the Central Indicators scanner currently detects an excess:
RSI indicator is overbought : over 70
Type : Neutral
Timeframe : Daily
CCI indicator is overbought : over 100
Type : Neutral
Timeframe : Daily
Previous candle closed over Bollinger bands
Type : Neutral
Timeframe : Daily
Williams %R indicator is overbought : over -20
Type : Neutral
Timeframe : Daily
Pivot points : price is over resistance 1
Type : Neutral
Timeframe : Daily
Pivot points : price is over resistance 3
Type : Neutral
Timeframe : Weekly
Central Patterns, the market scanner focusing on chart patterns, resistances and supports found this result:
Resistance of channel is broken
Type : Bullish
Timeframe : Daily
No result was found by the Central Candlesticks scanner on Japanese candlesticks.
| S3 | S2 | S1 | Price | R1 | R2 | |
|---|---|---|---|---|---|---|
| ProTrendLines | 137.01 | 146.66 | 149.64 | 152.23 | 173.61 | 184.59 |
| Change (%) | -10.00% | -3.66% | -1.70% | - | +14.04% | +21.26% |
| Change | -15.22 | -5.57 | -2.59 | - | +21.38 | +32.36 |
| Level | Major | Major | Intermediate | - | Minor | Major |
To determine price objectives, it is also possible to use the pivot points. Here is the price position in relation to pivot points:
| Pivot points | S3 | S2 | S1 | PP | R1 | R2 | R3 |
|---|---|---|---|---|---|---|---|
| Standard | 150.13 | 150.47 | 151.13 | 151.48 | 152.14 | 152.48 | 153.14 |
| Camarilla | 151.51 | 151.61 | 151.70 | 151.79 | 151.88 | 151.97 | 152.07 |
| Woodie | 150.28 | 150.55 | 151.29 | 151.55 | 152.29 | 152.56 | 153.30 |
| Fibonacci | 150.47 | 150.85 | 151.09 | 151.48 | 151.86 | 152.10 | 152.48 |
| Pivot points | S3 | S2 | S1 | PP | R1 | R2 | R3 |
|---|---|---|---|---|---|---|---|
| Standard | 145.51 | 146.26 | 147.63 | 148.38 | 149.75 | 150.50 | 151.87 |
| Camarilla | 148.42 | 148.61 | 148.81 | 149.00 | 149.19 | 149.39 | 149.58 |
| Woodie | 145.82 | 146.42 | 147.94 | 148.54 | 150.06 | 150.66 | 152.18 |
| Fibonacci | 146.26 | 147.07 | 147.57 | 148.38 | 149.19 | 149.69 | 150.50 |
| Pivot points | S3 | S2 | S1 | PP | R1 | R2 | R3 |
|---|---|---|---|---|---|---|---|
| Standard | 138.98 | 141.19 | 145.26 | 147.47 | 151.54 | 153.75 | 157.82 |
| Camarilla | 147.60 | 148.18 | 148.75 | 149.33 | 149.91 | 150.48 | 151.06 |
| Woodie | 139.91 | 141.66 | 146.19 | 147.94 | 152.47 | 154.22 | 158.75 |
| Fibonacci | 141.19 | 143.59 | 145.07 | 147.47 | 149.87 | 151.35 | 153.75 |
Numerical data
The following is the status of technical indicators and moving averages registered at the time this technical analysis was created:
| RSI (14): | 73.38 | |
| MACD (12,26,9): | 1.4700 | |
| Directional Movement: | 29.71 | |
| AROON (14): | 78.57 | |
| DEMA (21): | 150.45 | |
| Parabolic SAR (0,02-0,02-0,2): | 146.42 | |
| Elder Ray (13): | 3.10 | |
| Super Trend (3,10): | 148.98 | |
| Zig ZAG (10): | 152.22 | |
| VORTEX (21): | 1.1200 | |
| Stochastique (14,3,5): | 95.90 | |
| TEMA (21): | 150.61 | |
| Williams %R (14): | -8.25 | |
| Chande Momentum Oscillator (20): | 3.89 | |
| Repulse (5,40,3): | 1.0700 | |
| ROCnROLL: | 1 | |
| TRIX (15,9): | 0.1200 | |
| Courbe Coppock: | 2.61 |
| MA7: | 149.64 | |
| MA20: | 148.51 | |
| MA50: | 145.18 | |
| MA100: | 142.43 | |
| MAexp7: | 150.22 | |
| MAexp20: | 148.53 | |
| MAexp50: | 145.96 | |
| MAexp100: | 143.17 | |
| Price / MA7: | +1.73% | |
| Price / MA20: | +2.50% | |
| Price / MA50: | +4.86% | |
| Price / MA100: | +6.88% | |
| Price / MAexp7: | +1.34% | |
| Price / MAexp20: | +2.49% | |
| Price / MAexp50: | +4.30% | |
| Price / MAexp100: | +6.33% |
About author

Online


Add a comment
Comments
0 comments on the analysis SPDR GOLD TRUST - Daily