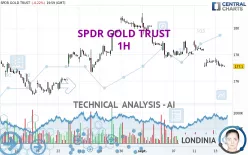
SPDR GOLD TRUST - 1H - Technical analysis published on 09/14/2023 (GMT)
- 98
- 0
Click here for a new analysis!
- Timeframe : 1H
- - Analysis generated on
- Status : INVALID

Summary of the analysis

Additional analysis
Quotes
The SPDR GOLD TRUST rating is 177.08 USD. On the day, this instrument lost -0.23% and was between 177.04 USD and 177.75 USD. This implies that the price is at +0.02% from its lowest and at -0.38% from its highest.The Central Gaps scanner detects a bullish opening marking the presence of buyers ahead of sellers at the opening but not sufficiently marked to allow the price to register a quotation gap.
Bullish opening
Type : Bullish
Timeframe : Openning
So that you have an overall view of the price change, here is a table showing the variations over several periods:
Near a new LOW record (1st january)
Type : Bearish
Timeframe : Weekly
Near a new HIGH record (1 month)
Type : Bullish
Timeframe : Weekly
Technical
Technical analysis of this 1H chart of SPDR GOLD TRUST indicates that the overall trend is strongly bearish. The signals given by moving averages are 92.86% bearish. This strong bearish trend is confirmed by the strong signals currently being given by short-term moving averages. The Central Indicators scanner does not detect any result on moving averages that would impact this trend.
In fact, 10 technical indicators on 18 studied are currently bearish. But beware of excesses. The Central Indicators scanner currently detects this:
Williams %R indicator is oversold : under -80
Type : Neutral
Timeframe : 1 hour
Pivot points : price is under support 1
Type : Neutral
Timeframe : 1 hour
Pivot points : price is under support 1
Type : Neutral
Timeframe : Weekly
Momentum indicator is back under 0
Type : Bearish
Timeframe : 1 hour
An analysis of the price chart with the Central Patterns scanner (detector of chart patterns and resistances and supports) shows a result that can have an impact on the price change:
Near horizontal support
Type : Bullish
Timeframe : 1 hour
The Central Candlesticks scanner, specialised in Japanese candlesticks, did not identify any signals.
| S3 | S2 | S1 | Price | R1 | R2 | R3 | |
|---|---|---|---|---|---|---|---|
| ProTrendLines | 173.61 | 174.94 | 175.93 | 177.08 | 177.11 | 177.71 | 178.48 |
| Change (%) | -1.96% | -1.21% | -0.65% | - | +0.02% | +0.36% | +0.79% |
| Change | -3.47 | -2.14 | -1.15 | - | +0.03 | +0.63 | +1.40 |
| Level | Major | Major | Minor | - | Major | Intermediate | Minor |
Pivot points can also be used to set your price objectives. Here is the price situation in relation to pivot points:
| Pivot points | S3 | S2 | S1 | PP | R1 | R2 | R3 |
|---|---|---|---|---|---|---|---|
| Standard | 176.12 | 176.58 | 176.83 | 177.29 | 177.54 | 178.00 | 178.25 |
| Camarilla | 176.89 | 176.95 | 177.02 | 177.08 | 177.15 | 177.21 | 177.28 |
| Woodie | 176.02 | 176.53 | 176.73 | 177.24 | 177.44 | 177.95 | 178.15 |
| Fibonacci | 176.58 | 176.85 | 177.02 | 177.29 | 177.56 | 177.73 | 178.00 |
| Pivot points | S3 | S2 | S1 | PP | R1 | R2 | R3 |
|---|---|---|---|---|---|---|---|
| Standard | 175.63 | 176.67 | 177.37 | 178.41 | 179.11 | 180.15 | 180.85 |
| Camarilla | 177.60 | 177.76 | 177.92 | 178.08 | 178.24 | 178.40 | 178.56 |
| Woodie | 175.47 | 176.59 | 177.21 | 178.33 | 178.95 | 180.07 | 180.69 |
| Fibonacci | 176.67 | 177.33 | 177.74 | 178.41 | 179.07 | 179.48 | 180.15 |
| Pivot points | S3 | S2 | S1 | PP | R1 | R2 | R3 |
|---|---|---|---|---|---|---|---|
| Standard | 169.72 | 172.33 | 176.17 | 178.78 | 182.62 | 185.23 | 189.07 |
| Camarilla | 178.25 | 178.84 | 179.43 | 180.02 | 180.61 | 181.20 | 181.79 |
| Woodie | 170.35 | 172.64 | 176.80 | 179.09 | 183.25 | 185.54 | 189.70 |
| Fibonacci | 172.33 | 174.79 | 176.31 | 178.78 | 181.24 | 182.76 | 185.23 |
Numerical data
The following is the status of the technical indicators and moving averages at the time of publication of this technical analysis:
| RSI (14): | 35.35 | |
| MACD (12,26,9): | -0.3100 | |
| Directional Movement: | -7.35 | |
| AROON (14): | -85.71 | |
| DEMA (21): | 177.16 | |
| Parabolic SAR (0,02-0,02-0,2): | 178.54 | |
| Elder Ray (13): | -0.30 | |
| Super Trend (3,10): | 177.99 | |
| Zig ZAG (10): | 177.09 | |
| VORTEX (21): | 0.9100 | |
| Stochastique (14,3,5): | 9.97 | |
| TEMA (21): | 177.08 | |
| Williams %R (14): | -91.61 | |
| Chande Momentum Oscillator (20): | -0.30 | |
| Repulse (5,40,3): | -0.0900 | |
| ROCnROLL: | 2 | |
| TRIX (15,9): | -0.0200 | |
| Courbe Coppock: | 0.98 |
| MA7: | 177.94 | |
| MA20: | 177.77 | |
| MA50: | 179.26 | |
| MA100: | 181.09 | |
| MAexp7: | 177.24 | |
| MAexp20: | 177.56 | |
| MAexp50: | 178.01 | |
| MAexp100: | 178.22 | |
| Price / MA7: | -0.48% | |
| Price / MA20: | -0.39% | |
| Price / MA50: | -1.22% | |
| Price / MA100: | -2.21% | |
| Price / MAexp7: | -0.08% | |
| Price / MAexp20: | -0.26% | |
| Price / MAexp50: | -0.51% | |
| Price / MAexp100: | -0.63% |
About author

Online


Add a comment
Comments
0 comments on the analysis SPDR GOLD TRUST - 1H