| Open: | 351.0 |
| Change: | +6.0 |
| Volume: | 103 |
| Low: | 349.0 |
| High: | 366.0 |
| High / Low range: | 17.0 |
| Type: | ETF |
| Ticker: | GLD |
| ISIN: |
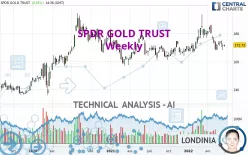
SPDR GOLD TRUST - Weekly - Technical analysis published on 06/23/2022 (GMT)
- 172
- 0
- 06/23/2022 - 14:51
- Timeframe : Weekly
- - Analysis generated on 06/23/2022 - 14:51
- Status : NEUTRAL

Summary of the analysis

Additional analysis
Quotes
The SPDR GOLD TRUST price is 171.73 USD. The price is lower by -0.56% over the 5 days and was traded between 170.47 USD and 171.91 USD over the period. The price is currently at +0.74% from its lowest point and -0.10% from its highest point.The Central Gaps scanner detects a bullish opening marking the presence of buyers ahead of sellers at the opening but not sufficiently marked to allow the price to register a quotation gap.
Bullish opening
Type : Bullish
Timeframe : Openning
A study of price movements over other periods shows the following variations:
Near a new LOW record (1st january)
Type : Bearish
Timeframe : Weekly
Near a new HIGH record (1 month)
Type : Bullish
Timeframe : Weekly
Technical
Technical analysis of this Weekly chart of SPDR GOLD TRUST indicates that the overall trend is not clearly defined. This generally neutral trend is confirmed by the neutral signals currently given by short-term moving averages. The Central Indicators scanner detects bullish signals on moving averages that could impact this trend:
Bullish price crossover with Moving Average 50
Type : Bullish
Timeframe : Weekly
Bullish price crossover with adaptative moving average 100
Type : Bullish
Timeframe : Weekly
In fact, Central Analyzer took into account 18 technical indicators and the result was as follows: 4 are bullish, 6 are neutral and 8 are bearish. The Central Indicators scanner found this result concerning these indicators:
MACD indicator is back under 0
Type : Bearish
Timeframe : Weekly
The Central Patterns scanner, which studies chart patterns, resistances and supports, has identified this signal:
Near support of triangle
Type : Bullish
Timeframe : Weekly
The Central Candlesticks scanner, specialised in Japanese candlesticks, did not identify any signals.
| S3 | S2 | S1 | Price | R1 | R2 | R3 | |
|---|---|---|---|---|---|---|---|
| ProTrendLines | 129.87 | 138.21 | 157.49 | 171.73 | 173.61 | 183.03 | 193.89 |
| Change (%) | -24.38% | -19.52% | -8.29% | - | +1.09% | +6.58% | +12.90% |
| Change | -41.86 | -33.52 | -14.24 | - | +1.88 | +11.30 | +22.16 |
| Level | Major | Minor | Major | - | Major | Intermediate | Major |
To determine price objectives, it is also possible to use the pivot points. Here is the price position in relation to pivot points:
| Pivot points | S3 | S2 | S1 | PP | R1 | R2 | R3 |
|---|---|---|---|---|---|---|---|
| Standard | 169.64 | 170.37 | 170.84 | 171.57 | 172.04 | 172.77 | 173.24 |
| Camarilla | 170.98 | 171.09 | 171.20 | 171.31 | 171.42 | 171.53 | 171.64 |
| Woodie | 169.51 | 170.31 | 170.71 | 171.51 | 171.91 | 172.71 | 173.11 |
| Fibonacci | 170.37 | 170.83 | 171.11 | 171.57 | 172.03 | 172.31 | 172.77 |
| Pivot points | S3 | S2 | S1 | PP | R1 | R2 | R3 |
|---|---|---|---|---|---|---|---|
| Standard | 164.32 | 166.31 | 168.79 | 170.78 | 173.26 | 175.25 | 177.73 |
| Camarilla | 170.04 | 170.45 | 170.86 | 171.27 | 171.68 | 172.09 | 172.50 |
| Woodie | 164.57 | 166.43 | 169.04 | 170.90 | 173.51 | 175.37 | 177.98 |
| Fibonacci | 166.31 | 168.02 | 169.07 | 170.78 | 172.49 | 173.54 | 175.25 |
| Pivot points | S3 | S2 | S1 | PP | R1 | R2 | R3 |
|---|---|---|---|---|---|---|---|
| Standard | 157.30 | 162.65 | 166.90 | 172.25 | 176.50 | 181.85 | 186.10 |
| Camarilla | 168.50 | 169.38 | 170.26 | 171.14 | 172.02 | 172.90 | 173.78 |
| Woodie | 156.74 | 162.38 | 166.34 | 171.98 | 175.94 | 181.58 | 185.54 |
| Fibonacci | 162.65 | 166.32 | 168.59 | 172.25 | 175.92 | 178.19 | 181.85 |
Numerical data
The following are the details of the technical indicators and moving averages that were collected to generate this technical analysis:
| RSI (14): | 46.40 | |
| MACD (12,26,9): | -0.0900 | |
| Directional Movement: | -6.28 | |
| AROON (14): | -21.43 | |
| DEMA (21): | 174.85 | |
| Parabolic SAR (0,02-0,02-0,2): | 184.66 | |
| Elder Ray (13): | -2.75 | |
| Super Trend (3,10): | 185.34 | |
| Zig ZAG (10): | 171.72 | |
| VORTEX (21): | 1.0000 | |
| Stochastique (14,3,5): | 21.41 | |
| TEMA (21): | 173.38 | |
| Williams %R (14): | -79.71 | |
| Chande Momentum Oscillator (20): | -7.82 | |
| Repulse (5,40,3): | 1.6400 | |
| ROCnROLL: | 2 | |
| TRIX (15,9): | 0.1000 | |
| Courbe Coppock: | 7.18 |
| MA7: | 170.97 | |
| MA20: | 172.01 | |
| MA50: | 174.37 | |
| MA100: | 176.34 | |
| MAexp7: | 173.00 | |
| MAexp20: | 174.32 | |
| MAexp50: | 172.68 | |
| MAexp100: | 168.30 | |
| Price / MA7: | +0.44% | |
| Price / MA20: | -0.16% | |
| Price / MA50: | -1.51% | |
| Price / MA100: | -2.61% | |
| Price / MAexp7: | -0.73% | |
| Price / MAexp20: | -1.49% | |
| Price / MAexp50: | -0.55% | |
| Price / MAexp100: | +2.04% |
About author

Online


Add a comment
Comments
0 comments on the analysis SPDR GOLD TRUST - Weekly