JPY/DKK - Daily - Technical analysis published on 03/31/2023 (GMT)
- 158
- 0
Click here for a new analysis!
- Timeframe : Daily
- - Analysis generated on
- Status : TARGET REACHED
Summary of the analysis

Additional analysis
Quotes
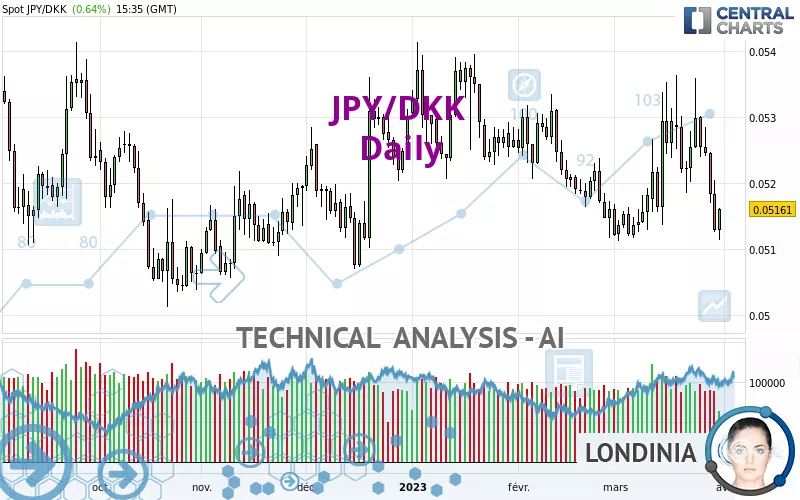
The JPY/DKK price is 0.05161 DKK. The price has increased by +0.64% since the last closing and was between 0.05113 DKK and 0.05162 DKK. This implies that the price is at +0.94% from its lowest and at -0.02% from its highest.So that you have an overall view of the price change, here is a table showing the variations over several periods:
Near a new LOW record (5 years)
Type : Bearish
Timeframe : Weekly
Near a new LOW record (1 year)
Type : Bearish
Timeframe : Weekly
Near a new HIGH record (1st january)
Type : Bullish
Timeframe : Weekly
Near a new HIGH record (1 month)
Type : Bullish
Timeframe : Weekly
Technical
A technical analysis in Daily of this JPY/DKK chart shows a sharp bearish trend. 89.29% of the signals given by moving averages are bearish. This strongly bearish trend is showing signs of slowing down given the slightly bearish signals given by short-term moving averages. The Central Indicators market scanner is currently detecting a bearish signal that could impact this trend:
Bearish trend reversal : Moving Average 100
Type : Bearish
Timeframe : Daily
An assessment of technical indicators does not currently provide any relevant information to suggest whether the signal given by the technical indicators is more bullish or bearish.
But beware of excesses. The Central Indicators scanner currently detects this:
Williams %R indicator is oversold : under -80
Type : Neutral
Timeframe : Daily
Pivot points : price is under support 1
Type : Neutral
Timeframe : Weekly
MACD indicator is back under 0
Type : Bearish
Timeframe : Daily
Ichimoku - Bearish crossover : Tenkan & Kijun
Type : Bearish
Timeframe : Daily
Price is back over the pivot point
Type : Bullish
Timeframe : Daily
The Central Patterns scanner, which studies chart patterns, resistances and supports, has identified these signals:
Near horizontal support
Type : Bullish
Timeframe : Daily
Support of channel is broken
Type : Bearish
Timeframe : Daily
The Central Candlesticks scanner, specialised in Japanese candlesticks, did not identify any signals.
| S3 | S2 | S1 | Price | R1 | R2 | R3 | |
|---|---|---|---|---|---|---|---|
| ProTrendLines | 0.05075 | 0.05121 | 0.05159 | 0.05161 | 0.05294 | 0.05374 | 0.05425 |
| Change (%) | -1.67% | -0.78% | -0.04% | - | +2.58% | +4.13% | +5.12% |
| Change | -0.00086 | -0.00040 | -0.00002 | - | +0.00133 | +0.00213 | +0.00264 |
| Level | Intermediate | Major | Intermediate | - | Intermediate | Major | Minor |
Attention could also be paid to pivot points to set price objectives:
| Pivot points | S3 | S2 | S1 | PP | R1 | R2 | R3 |
|---|---|---|---|---|---|---|---|
| Standard | 0.05022 | 0.05073 | 0.05101 | 0.05152 | 0.05180 | 0.05231 | 0.05259 |
| Camarilla | 0.05106 | 0.05114 | 0.05121 | 0.05128 | 0.05135 | 0.05143 | 0.05150 |
| Woodie | 0.05010 | 0.05067 | 0.05089 | 0.05146 | 0.05168 | 0.05225 | 0.05247 |
| Fibonacci | 0.05073 | 0.05104 | 0.05122 | 0.05152 | 0.05183 | 0.05201 | 0.05231 |
| Pivot points | S3 | S2 | S1 | PP | R1 | R2 | R3 |
|---|---|---|---|---|---|---|---|
| Standard | 0.05023 | 0.05104 | 0.05201 | 0.05282 | 0.05379 | 0.05460 | 0.05557 |
| Camarilla | 0.05249 | 0.05265 | 0.05282 | 0.05298 | 0.05314 | 0.05331 | 0.05347 |
| Woodie | 0.05031 | 0.05108 | 0.05209 | 0.05286 | 0.05387 | 0.05464 | 0.05565 |
| Fibonacci | 0.05104 | 0.05172 | 0.05214 | 0.05282 | 0.05350 | 0.05392 | 0.05460 |
| Pivot points | S3 | S2 | S1 | PP | R1 | R2 | R3 |
|---|---|---|---|---|---|---|---|
| Standard | 0.04855 | 0.04986 | 0.05073 | 0.05204 | 0.05291 | 0.05422 | 0.05509 |
| Camarilla | 0.05101 | 0.05121 | 0.05141 | 0.05161 | 0.05181 | 0.05201 | 0.05221 |
| Woodie | 0.04834 | 0.04975 | 0.05052 | 0.05193 | 0.05270 | 0.05411 | 0.05488 |
| Fibonacci | 0.04986 | 0.05069 | 0.05120 | 0.05204 | 0.05287 | 0.05338 | 0.05422 |
Numerical data
The following is the status of technical indicators and moving averages registered at the time this technical analysis was created:
| RSI (14): | 43.73 | |
| MACD (12,26,9): | -0.0001 | |
| Directional Movement: | 2.22005 | |
| AROON (14): | -64.28571 | |
| DEMA (21): | 0.05207 | |
| Parabolic SAR (0,02-0,02-0,2): | 0.05345 | |
| Elder Ray (13): | -0.00072 | |
| Super Trend (3,10): | 0.05083 | |
| Zig ZAG (10): | 0.05155 | |
| VORTEX (21): | 1.0007 | |
| Stochastique (14,3,5): | 13.71 | |
| TEMA (21): | 0.05207 | |
| Williams %R (14): | -82.80 | |
| Chande Momentum Oscillator (20): | -0.00138 | |
| Repulse (5,40,3): | -1.1511 | |
| ROCnROLL: | 2 | |
| TRIX (15,9): | 0.0142 | |
| Courbe Coppock: | 0.90 |
| MA7: | 0.05217 | |
| MA20: | 0.05210 | |
| MA50: | 0.05219 | |
| MA100: | 0.05222 | |
| MAexp7: | 0.05195 | |
| MAexp20: | 0.05211 | |
| MAexp50: | 0.05217 | |
| MAexp100: | 0.05225 | |
| Price / MA7: | -1.07% | |
| Price / MA20: | -0.94% | |
| Price / MA50: | -1.11% | |
| Price / MA100: | -1.17% | |
| Price / MAexp7: | -0.65% | |
| Price / MAexp20: | -0.96% | |
| Price / MAexp50: | -1.07% | |
| Price / MAexp100: | -1.22% |
About author
Online


Add a comment
Comments
0 comments on the analysis JPY/DKK - Daily