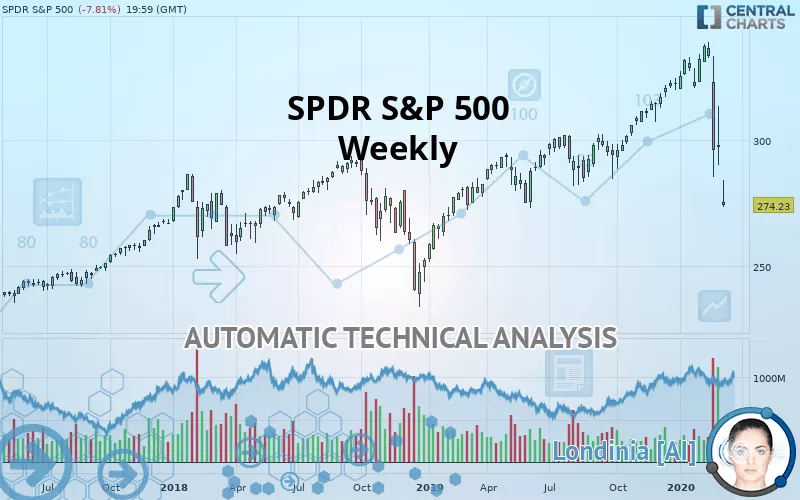
SPDR S&P 500 - Weekly - Technical analysis published on 03/10/2020 (GMT)
- 273
- 0
- Who voted?
Click here for a new analysis!
- Timeframe : Weekly
- - Analysis generated on
- Status : TARGET REACHED
Summary of the analysis

Additional analysis
Quotes
The SPDR S&P 500 price is 274.23 USD. The price registered a decrease of -8.66% over 5 days with the lowest point at 273.45 USD and the highest point at 298.78 USD. The deviation from the price is +0.29% for the low point and -8.22% for the high point.The Central Gaps scanner detects a bearish gap which is a sign that the sellers have taken the lead in the very short term.
Opening Gap DOWN
Type : Bearish
Timeframe : Openning
A study of price movements over other periods shows the following variations:
Near a new LOW record (1 year)
Type : Bearish
Timeframe : Weekly
Abnormal volumes on SPDR S&P 500 were detected by the Central Volumes scanner:
Abnormal volumes
Timeframe : 5 days
Abnormal volumes
Timeframe : 20 days
Technical
A technical analysis in Weekly of this SPDR S&P 500 chart shows a slightly bearish trend. Only 60.71% of the signals given by moving averages are bearish. This slightly bearish trend is reinforced by the strong signals currently being given by short-term moving averages. There is no crossing of moving average by the price or crossing of moving averages between themselves.
The probability of a further decline is moderate given the direction of the technical indicators.
Caution: the Central Indicators scanner currently detects an excess:
CCI indicator is oversold : under -100
Type : Neutral
Timeframe : Weekly
Pivot points : price is under support 3
Type : Neutral
Timeframe : Weekly
The Central Patterns scanner, which studies chart patterns, resistances and supports, has identified these signals:
Near horizontal support
Type : Bullish
Timeframe : Weekly
Near support of channel
Type : Bullish
Timeframe : Weekly
Central Candlesticks, the scanner specialised in Japanese candlesticks, detects this inversion signal that could impact the current short-term trend:
Doji
Type : Neutral
Timeframe : Weekly
| S3 | S2 | S1 | Price | R1 | R2 | R3 | |
|---|---|---|---|---|---|---|---|
| ProTrendLines | 156.48 | 234.37 | 257.52 | 274.23 | 274.57 | 293.58 | 301.87 |
| Change (%) | -42.94% | -14.54% | -6.09% | - | +0.12% | +7.06% | +10.08% |
| Change | -117.75 | -39.86 | -16.71 | - | +0.34 | +19.35 | +27.64 |
| Level | Minor | Major | Minor | - | Minor | Major | Major |
To determine price objectives, it is also possible to use the pivot points. Here is the price position in relation to pivot points:
| Pivot points | S3 | S2 | S1 | PP | R1 | R2 | R3 |
|---|---|---|---|---|---|---|---|
| Standard | 283.65 | 286.94 | 292.20 | 295.49 | 300.75 | 304.04 | 309.30 |
| Camarilla | 295.11 | 295.89 | 296.68 | 297.46 | 298.24 | 299.03 | 299.81 |
| Woodie | 284.64 | 287.43 | 293.19 | 295.98 | 301.74 | 304.53 | 310.29 |
| Fibonacci | 286.94 | 290.21 | 292.22 | 295.49 | 298.76 | 300.77 | 304.04 |
| Pivot points | S3 | S2 | S1 | PP | R1 | R2 | R3 |
|---|---|---|---|---|---|---|---|
| Standard | 263.57 | 276.90 | 287.18 | 300.51 | 310.79 | 324.12 | 334.40 |
| Camarilla | 290.97 | 293.13 | 295.30 | 297.46 | 299.62 | 301.79 | 303.95 |
| Woodie | 262.05 | 276.14 | 285.66 | 299.75 | 309.27 | 323.36 | 332.88 |
| Fibonacci | 276.90 | 285.92 | 291.49 | 300.51 | 309.53 | 315.10 | 324.12 |
| Pivot points | S3 | S2 | S1 | PP | R1 | R2 | R3 |
|---|---|---|---|---|---|---|---|
| Standard | 221.30 | 253.42 | 274.84 | 306.96 | 328.38 | 360.50 | 381.92 |
| Camarilla | 281.54 | 286.44 | 291.35 | 296.26 | 301.17 | 306.08 | 310.98 |
| Woodie | 215.95 | 250.75 | 269.49 | 304.29 | 323.03 | 357.83 | 376.57 |
| Fibonacci | 253.42 | 273.87 | 286.51 | 306.96 | 327.41 | 340.05 | 360.50 |
Numerical data
The following is the status of technical indicators and moving averages registered at the time this technical analysis was created:
| RSI (14): | 31.18 | |
| MACD (12,26,9): | 0.7600 | |
| Directional Movement: | -27.04 | |
| AROON (14): | -21.43 | |
| DEMA (21): | 315.15 | |
| Parabolic SAR (0,02-0,02-0,2): | 338.01 | |
| Elder Ray (13): | -32.41 | |
| Super Trend (3,10): | 318.88 | |
| Zig ZAG (10): | 274.23 | |
| VORTEX (21): | 0.8700 | |
| Stochastique (14,3,5): | 14.49 | |
| TEMA (21): | 309.49 | |
| Williams %R (14): | -98.81 | |
| Chande Momentum Oscillator (20): | -46.50 | |
| Repulse (5,40,3): | -8.9100 | |
| ROCnROLL: | 2 | |
| TRIX (15,9): | 0.3300 | |
| Courbe Coppock: | 1.24 |
| MA7: | 298.94 | |
| MA20: | 318.21 | |
| MA50: | 323.43 | |
| MA100: | 316.65 | |
| MAexp7: | 305.18 | |
| MAexp20: | 311.47 | |
| MAexp50: | 302.38 | |
| MAexp100: | 287.97 | |
| Price / MA7: | -8.27% | |
| Price / MA20: | -13.82% | |
| Price / MA50: | -15.21% | |
| Price / MA100: | -13.40% | |
| Price / MAexp7: | -10.14% | |
| Price / MAexp20: | -11.96% | |
| Price / MAexp50: | -9.31% | |
| Price / MAexp100: | -4.77% |
About author

Online


Add a comment
Comments
0 comments on the analysis SPDR S&P 500 - Weekly