| Open: | - |
| Change: | - |
| Volume: | - |
| Low: | - |
| High: | - |
| High / Low range: | - |
| Type: | ETF |
| Ticker: | SPY |
| ISIN: |
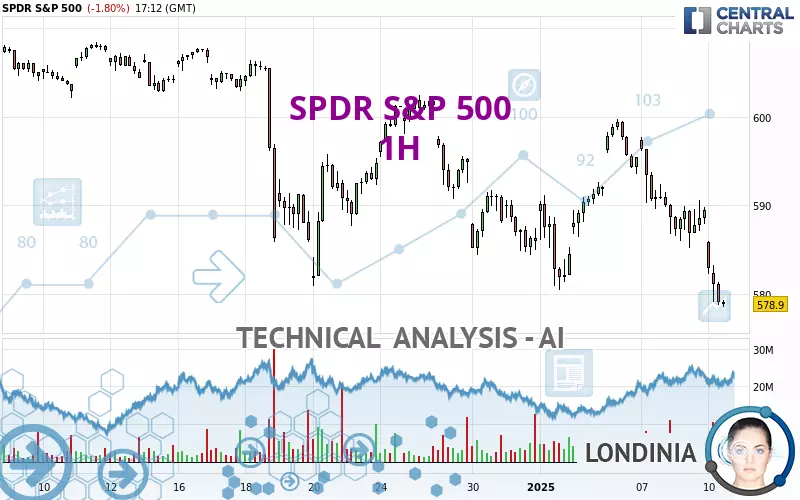
SPDR S&P 500 - 1H - Technical analysis published on 01/10/2025 (GMT)
- 127
- 0
- 01/10/2025 - 17:28
Click here for a new analysis!
- Timeframe : 1H
- - Analysis generated on 01/10/2025 - 17:28
- Status : INVALID
Summary of the analysis

Additional analysis
Quotes
The SPDR S&P 500 rating is 578.88 USD. The price registered a decrease of -1.80% on the session and was between 578.55 USD and 585.95 USD. This implies that the price is at +0.06% from its lowest and at -1.21% from its highest.The Central Gaps scanner detects a bearish opening marking the presence of sellers ahead of buyers at the opening but not sufficiently marked to allow the price to register a quotation gap.
Bearish opening
Type : Bearish
Timeframe : Openning
So that you have an overall view of the price change, here is a table showing the variations over several periods:
Near a new HIGH record (5 years)
Type : Bullish
Timeframe : Weekly
Near a new HIGH record (1 year)
Type : Bullish
Timeframe : Weekly
Near a new HIGH record (1st january)
Type : Bullish
Timeframe : Weekly
New LOW record (1st january)
Type : Bearish
Timeframe : Weekly
Near a new HIGH record (1 month)
Type : Bullish
Timeframe : Weekly
New LOW record (1 month)
Type : Bearish
Timeframe : Weekly
Technical
Technical analysis of SPDR S&P 500 in 1H shows a overall strongly bearish trend. The signals given by moving averages are 89.29% bearish. This strong bearish trend is confirmed by the strong signals currently being given by short-term moving averages. An assessment of moving averages reveals a bearish signal that could impact this trend:
Moving Average bearish crossovers : MA20 & MA50
Type : Bearish
Timeframe : 1 hour
An assessment of technical indicators shows a strong bearish signal.
Caution: the Central Indicators scanner currently detects an excess:
CCI indicator is oversold : under -100
Type : Neutral
Timeframe : 1 hour
Williams %R indicator is oversold : under -80
Type : Neutral
Timeframe : 1 hour
Pivot points : price is under support 1
Type : Neutral
Timeframe : Weekly
Pivot points : price is under support 3
Type : Neutral
Timeframe : 1 hour
The analysis of the price chart with Central Patterns scanners does not return any result.
No result was found by the Central Candlesticks scanner on Japanese candlesticks.
| S3 | S2 | S1 | Price | R1 | R2 | R3 | |
|---|---|---|---|---|---|---|---|
| ProTrendLines | 491.91 | 515.64 | 538.54 | 578.88 | 580.91 | 584.16 | 587.66 |
| Change (%) | -15.02% | -10.92% | -6.97% | - | +0.35% | +0.91% | +1.52% |
| Change | -86.97 | -63.24 | -40.34 | - | +2.03 | +5.28 | +8.78 |
| Level | Minor | Major | Minor | - | Intermediate | Major | Minor |
Attention could also be paid to pivot points to set price objectives:
| Pivot points | S3 | S2 | S1 | PP | R1 | R2 | R3 |
|---|---|---|---|---|---|---|---|
| Standard | 580.89 | 583.04 | 586.27 | 588.42 | 591.65 | 593.80 | 597.03 |
| Camarilla | 588.01 | 588.50 | 589.00 | 589.49 | 589.98 | 590.48 | 590.97 |
| Woodie | 581.42 | 583.31 | 586.80 | 588.69 | 592.18 | 594.07 | 597.56 |
| Fibonacci | 583.04 | 585.10 | 586.37 | 588.42 | 590.48 | 591.75 | 593.80 |
| Pivot points | S3 | S2 | S1 | PP | R1 | R2 | R3 |
|---|---|---|---|---|---|---|---|
| Standard | 572.00 | 576.25 | 584.10 | 588.35 | 596.20 | 600.45 | 608.30 |
| Camarilla | 588.62 | 589.73 | 590.84 | 591.95 | 593.06 | 594.17 | 595.28 |
| Woodie | 573.80 | 577.15 | 585.90 | 589.25 | 598.00 | 601.35 | 610.10 |
| Fibonacci | 576.25 | 580.87 | 583.73 | 588.35 | 592.97 | 595.83 | 600.45 |
| Pivot points | S3 | S2 | S1 | PP | R1 | R2 | R3 |
|---|---|---|---|---|---|---|---|
| Standard | 549.54 | 565.23 | 575.65 | 591.34 | 601.76 | 617.45 | 627.87 |
| Camarilla | 578.90 | 581.29 | 583.69 | 586.08 | 588.47 | 590.87 | 593.26 |
| Woodie | 546.92 | 563.91 | 573.03 | 590.02 | 599.14 | 616.13 | 625.25 |
| Fibonacci | 565.23 | 575.20 | 581.36 | 591.34 | 601.31 | 607.47 | 617.45 |
Numerical data
The following is the status of technical indicators and moving averages registered at the time this technical analysis was created:
| RSI (14): | 32.74 | |
| MACD (12,26,9): | -1.8400 | |
| Directional Movement: | -25.29 | |
| AROON (14): | -100.00 | |
| DEMA (21): | 586.76 | |
| Parabolic SAR (0,02-0,02-0,2): | 589.79 | |
| Elder Ray (13): | -5.66 | |
| Super Trend (3,10): | 590.04 | |
| Zig ZAG (10): | 580.72 | |
| VORTEX (21): | 0.6900 | |
| Stochastique (14,3,5): | 9.35 | |
| TEMA (21): | 583.49 | |
| Williams %R (14): | -93.29 | |
| Chande Momentum Oscillator (20): | -10.93 | |
| Repulse (5,40,3): | -0.5200 | |
| ROCnROLL: | 2 | |
| TRIX (15,9): | -0.0300 | |
| Courbe Coppock: | 2.89 |
| MA7: | 588.06 | |
| MA20: | 593.75 | |
| MA50: | 592.30 | |
| MA100: | 578.89 | |
| MAexp7: | 584.39 | |
| MAexp20: | 588.87 | |
| MAexp50: | 590.58 | |
| MAexp100: | 592.44 | |
| Price / MA7: | -1.56% | |
| Price / MA20: | -2.50% | |
| Price / MA50: | -2.27% | |
| Price / MA100: | +0.00% | |
| Price / MAexp7: | -0.94% | |
| Price / MAexp20: | -1.70% | |
| Price / MAexp50: | -1.98% | |
| Price / MAexp100: | -2.29% |
About author

Online


Add a comment
Comments
0 comments on the analysis SPDR S&P 500 - 1H