SPDR S&P 500 - Weekly - Technical analysis published on 12/20/2024 (GMT)
- 85
- 0
- Timeframe : Weekly
- - Analysis generated on
- Status : IN PROGRESS...
Summary of the analysis

Additional analysis
Quotes
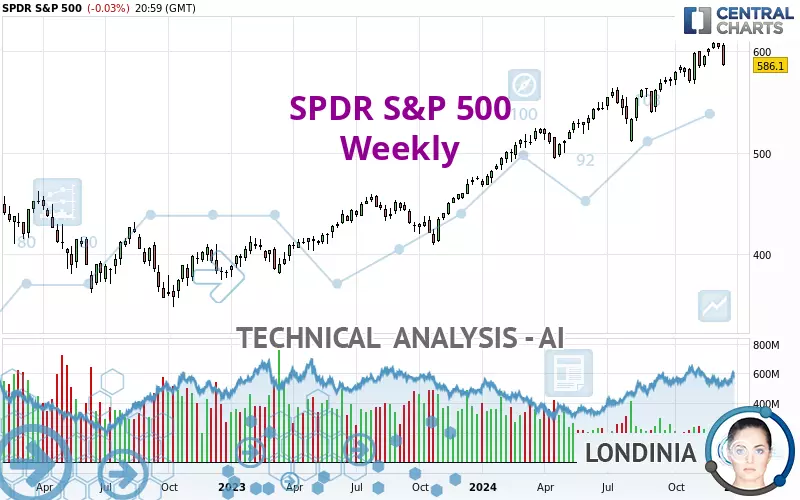
SPDR S&P 500 rating 586.10 USD. The price registered a decrease of -3.00% over 5 days and has been traded over the last 5 days between 585.85 USD and 607.78 USD. This implies that the 5 day price is +0.04% from its lowest point and -3.57% from its highest point.The Central Gaps scanner detects a bullish opening marking the presence of buyers ahead of sellers at the opening but not sufficiently marked to allow the price to register a quotation gap.
Bullish opening
Type : Bullish
Timeframe : Openning
A study of price movements over other periods shows the following variations:
Near a new HIGH record (5 years)
Type : Bullish
Timeframe : Weekly
Near a new HIGH record (1 year)
Type : Bullish
Timeframe : Weekly
Near a new HIGH record (1st january)
Type : Bullish
Timeframe : Weekly
Near a new HIGH record (1 month)
Type : Bullish
Timeframe : Weekly
Technical
A technical analysis in Weekly of this SPDR S&P 500 chart shows a strongly bullish trend. 92.86% of the signals given by moving averages are bullish. The overall trend is supported by the strong bullish signals from short-term moving averages. The Central Indicators market scanner currently does not detect any result that concerns moving averages.
The probability of a further increase is slight given the direction of the technical indicators.
Other results related to technical indicators were also found by the Central Indicators scanner:
Pivot points : price is under support 3
Type : Neutral
Timeframe : Weekly
MACD crosses DOWN its Moving Average
Type : Bearish
Timeframe : Weekly
Parabolic SAR indicator bearish reversal
Type : Bearish
Timeframe : Weekly
No signals are given by Central Patterns, a market scanner specialised in chart patterns, resistances and supports.
The Central Candlesticks scanner, specialised in Japanese candlesticks, did not identify any signals.
| S3 | S2 | S1 | Price | |
|---|---|---|---|---|
| ProTrendLines | 407.11 | 460.08 | 564.86 | 586.10 |
| Change (%) | -30.54% | -21.50% | -3.62% | - |
| Change | -178.99 | -126.02 | -21.24 | - |
| Level | Intermediate | Major | Major | - |
Pivot points can also be used to set your price objectives. Here is the price situation in relation to pivot points:
| Pivot points | S3 | S2 | S1 | PP | R1 | R2 | R3 |
|---|---|---|---|---|---|---|---|
| Standard | 576.48 | 581.17 | 583.63 | 588.32 | 590.78 | 595.47 | 597.93 |
| Camarilla | 584.13 | 584.79 | 585.45 | 586.10 | 586.76 | 587.41 | 588.07 |
| Woodie | 575.38 | 580.61 | 582.53 | 587.76 | 589.68 | 594.91 | 596.83 |
| Fibonacci | 581.17 | 583.90 | 585.59 | 588.32 | 591.05 | 592.74 | 595.47 |
| Pivot points | S3 | S2 | S1 | PP | R1 | R2 | R3 |
|---|---|---|---|---|---|---|---|
| Standard | 556.78 | 571.31 | 578.71 | 593.24 | 600.64 | 615.17 | 622.57 |
| Camarilla | 580.07 | 582.08 | 584.09 | 586.10 | 588.11 | 590.12 | 592.13 |
| Woodie | 553.21 | 569.53 | 575.14 | 591.46 | 597.07 | 613.39 | 619.00 |
| Fibonacci | 571.31 | 579.69 | 584.87 | 593.24 | 601.62 | 606.80 | 615.17 |
| Pivot points | S3 | S2 | S1 | PP | R1 | R2 | R3 |
|---|---|---|---|---|---|---|---|
| Standard | 543.71 | 555.80 | 579.17 | 591.26 | 614.63 | 626.72 | 650.09 |
| Camarilla | 592.79 | 596.04 | 599.29 | 602.54 | 605.79 | 609.04 | 612.29 |
| Woodie | 549.35 | 558.62 | 584.81 | 594.08 | 620.27 | 629.54 | 655.73 |
| Fibonacci | 555.80 | 569.35 | 577.71 | 591.26 | 604.81 | 613.17 | 626.72 |
Numerical data
The following is the status of the technical indicators and moving averages at the time of publication of this technical analysis:
| RSI (14): | 57.26 | |
| MACD (12,26,9): | 17.7700 | |
| Directional Movement: | 5.10 | |
| AROON (14): | 85.71 | |
| DEMA (21): | 601.81 | |
| Parabolic SAR (0,02-0,02-0,2): | 609.07 | |
| Elder Ray (13): | 10.16 | |
| Super Trend (3,10): | 566.49 | |
| Zig ZAG (10): | 586.10 | |
| VORTEX (21): | 1.1400 | |
| Stochastique (14,3,5): | 81.48 | |
| TEMA (21): | 602.45 | |
| Williams %R (14): | -46.72 | |
| Chande Momentum Oscillator (20): | 14.63 | |
| Repulse (5,40,3): | -3.8400 | |
| ROCnROLL: | -1 | |
| TRIX (15,9): | 0.4700 | |
| Courbe Coppock: | 13.79 |
| MA7: | 599.92 | |
| MA20: | 601.27 | |
| MA50: | 591.04 | |
| MA100: | 573.42 | |
| MAexp7: | 593.78 | |
| MAexp20: | 577.73 | |
| MAexp50: | 542.28 | |
| MAexp100: | 499.67 | |
| Price / MA7: | -2.30% | |
| Price / MA20: | -2.52% | |
| Price / MA50: | -0.84% | |
| Price / MA100: | +2.21% | |
| Price / MAexp7: | -1.29% | |
| Price / MAexp20: | +1.45% | |
| Price / MAexp50: | +8.08% | |
| Price / MAexp100: | +17.30% |
About author

Online


Add a comment
Comments
0 comments on the analysis SPDR S&P 500 - Weekly