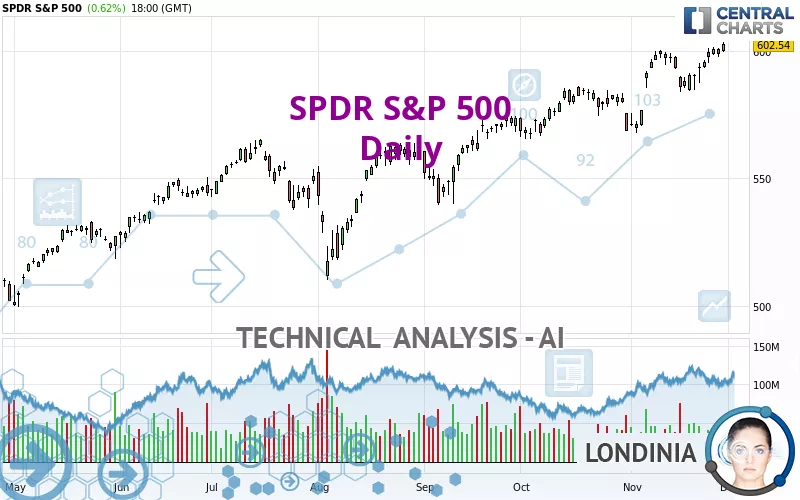
SPDR S&P 500 - Daily - Technical analysis published on 11/29/2024 (GMT)
- 107
- 0
- Timeframe : Daily
- - Analysis generated on
- Status : WITHOUT TARGET

Summary of the analysis

Additional analysis
Quotes
SPDR S&P 500 rating 602.54 USD. The price has increased by +0.62% since the last closing with the lowest point at 599.38 USD and the highest point at 603.35 USD. The deviation from the price is +0.53% for the low point and -0.13% for the high point.The Central Gaps scanner detects a bullish opening. A small advantage for buyers in the very short term.
Bullish opening
Type : Bullish
Timeframe : Openning
Here is a more detailed summary of the historical variations registered by SPDR S&P 500:
New HIGH record (5 years)
Type : Bullish
Timeframe : Weekly
New HIGH record (1 year)
Type : Bullish
Timeframe : Weekly
New HIGH record (1st january)
Type : Bullish
Timeframe : Weekly
New HIGH record (1 month)
Type : Bullish
Timeframe : Weekly
Technical
Technical analysis of this Daily chart of SPDR S&P 500 indicates that the overall trend is strongly bullish. The signals given by the moving averages are 92.86% bullish. This strong bullish trend is confirmed by the strong signals currently being given by short-term moving averages. The Central Indicators market scanner currently does not detect any result that concerns moving averages.
In fact, 13 technical indicators on 18 studied are currently bullish. Caution: the Central Indicators scanner currently detects an excess:
Williams %R indicator is overbought : over -20
Type : Neutral
Timeframe : Daily
Pivot points : price is over resistance 1
Type : Neutral
Timeframe : Daily
Pivot points : price is over resistance 1
Type : Neutral
Timeframe : Weekly
No signals are given by Central Patterns, a market scanner specialised in chart patterns, resistances and supports.
No result was found by the Central Candlesticks scanner on Japanese candlesticks.
| S3 | S2 | S1 | Price | |
|---|---|---|---|---|
| ProTrendLines | 521.24 | 564.86 | 598.76 | 602.54 |
| Change (%) | -13.49% | -6.25% | -0.63% | - |
| Change | -81.30 | -37.68 | -3.78 | - |
| Level | Intermediate | Major | Minor | - |
Pivot points can also be used to set your price objectives. Here is the price situation in relation to pivot points:
| Pivot points | S3 | S2 | S1 | PP | R1 | R2 | R3 |
|---|---|---|---|---|---|---|---|
| Standard | 593.55 | 595.42 | 597.12 | 598.99 | 600.69 | 602.56 | 604.26 |
| Camarilla | 597.85 | 598.18 | 598.50 | 598.83 | 599.16 | 599.49 | 599.81 |
| Woodie | 593.48 | 595.38 | 597.05 | 598.95 | 600.62 | 602.52 | 604.19 |
| Fibonacci | 595.42 | 596.78 | 597.62 | 598.99 | 600.35 | 601.19 | 602.56 |
| Pivot points | S3 | S2 | S1 | PP | R1 | R2 | R3 |
|---|---|---|---|---|---|---|---|
| Standard | 575.52 | 579.78 | 587.64 | 591.90 | 599.76 | 604.02 | 611.88 |
| Camarilla | 592.18 | 593.29 | 594.40 | 595.51 | 596.62 | 597.73 | 598.84 |
| Woodie | 577.33 | 580.68 | 589.45 | 592.80 | 601.57 | 604.92 | 613.69 |
| Fibonacci | 579.78 | 584.41 | 587.27 | 591.90 | 596.53 | 599.39 | 604.02 |
| Pivot points | S3 | S2 | S1 | PP | R1 | R2 | R3 |
|---|---|---|---|---|---|---|---|
| Standard | 539.72 | 552.49 | 560.57 | 573.34 | 581.42 | 594.19 | 602.27 |
| Camarilla | 562.91 | 564.82 | 566.73 | 568.64 | 570.55 | 572.46 | 574.37 |
| Woodie | 537.37 | 551.32 | 558.22 | 572.17 | 579.07 | 593.02 | 599.92 |
| Fibonacci | 552.49 | 560.46 | 565.38 | 573.34 | 581.31 | 586.23 | 594.19 |
Numerical data
The following are the details of the technical indicators and moving averages that were collected to generate this technical analysis:
| RSI (14): | 66.91 | |
| MACD (12,26,9): | 5.4300 | |
| Directional Movement: | 13.27 | |
| AROON (14): | 64.29 | |
| DEMA (21): | 599.37 | |
| Parabolic SAR (0,02-0,02-0,2): | 590.52 | |
| Elder Ray (13): | 6.31 | |
| Super Trend (3,10): | 585.37 | |
| Zig ZAG (10): | 602.94 | |
| VORTEX (21): | 1.0800 | |
| Stochastique (14,3,5): | 92.58 | |
| TEMA (21): | 600.09 | |
| Williams %R (14): | -4.00 | |
| Chande Momentum Oscillator (20): | 5.60 | |
| Repulse (5,40,3): | 0.7400 | |
| ROCnROLL: | 1 | |
| TRIX (15,9): | 0.1200 | |
| Courbe Coppock: | 3.01 |
| MA7: | 597.03 | |
| MA20: | 591.63 | |
| MA50: | 582.19 | |
| MA100: | 566.27 | |
| MAexp7: | 597.82 | |
| MAexp20: | 592.28 | |
| MAexp50: | 582.23 | |
| MAexp100: | 568.14 | |
| Price / MA7: | +0.92% | |
| Price / MA20: | +1.84% | |
| Price / MA50: | +3.50% | |
| Price / MA100: | +6.41% | |
| Price / MAexp7: | +0.79% | |
| Price / MAexp20: | +1.73% | |
| Price / MAexp50: | +3.49% | |
| Price / MAexp100: | +6.05% |
About author

Online


Add a comment
Comments
0 comments on the analysis SPDR S&P 500 - Daily