SPDR S&P 500 - 1H - Technical analysis published on 09/07/2024 (GMT)
- 101
- 0
Click here for a new analysis!
- Timeframe : 1H
- - Analysis generated on
- Status : INVALID
Summary of the analysis

Additional analysis
Quotes
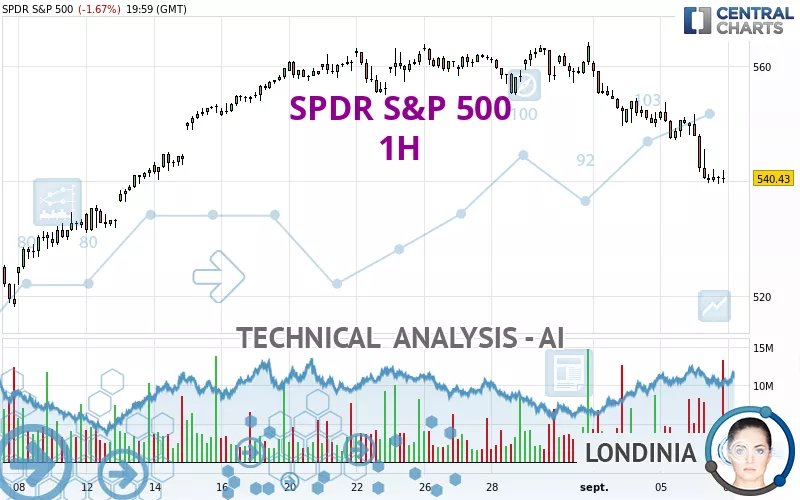
The SPDR S&P 500 rating is 540.36 USD. The price is lower by -1.68% since the last closing with the lowest point at 539.44 USD and the highest point at 551.60 USD. The deviation from the price is +0.17% for the low point and -2.04% for the high point.The Central Gaps scanner detects a bullish opening marking the presence of buyers ahead of sellers at the opening but not sufficiently marked to allow the price to register a quotation gap.
Bullish opening
Type : Bullish
Timeframe : Openning
Here is a more detailed summary of the historical variations registered by SPDR S&P 500:
Near a new HIGH record (5 years)
Type : Bullish
Timeframe : Weekly
Near a new HIGH record (1 year)
Type : Bullish
Timeframe : Weekly
Near a new HIGH record (1st january)
Type : Bullish
Timeframe : Weekly
Near a new HIGH record (1 month)
Type : Bullish
Timeframe : Weekly
Technical
Technical analysis of this 1H chart of SPDR S&P 500 indicates that the overall trend is strongly bearish. The signals given by moving averages are 92.86% bearish. This strong bearish trend is confirmed by the strong signals currently being given by short-term moving averages. There is no crossing of moving average by the price or crossing of moving averages between themselves.
In fact, Central Analyzer took into account 18 technical indicators and the result was as follows: 4 are bullish, 4 are neutral and 10 are bearish. But beware of excesses. The Central Indicators scanner currently detects this:
RSI indicator is oversold : under 30
Type : Neutral
Timeframe : 1 hour
CCI indicator is oversold : under -100
Type : Neutral
Timeframe : 1 hour
Williams %R indicator is oversold : under -80
Type : Neutral
Timeframe : 1 hour
Pivot points : price is under support 3
Type : Neutral
Timeframe : 1 hour
Pivot points : price is under support 3
Type : Neutral
Timeframe : Weekly
No signals are given by Central Patterns, a market scanner specialised in chart patterns, resistances and supports.
There is also a Japanese candlestick pattern detected by Central Candlesticks that could mark the end of the current short-term trend:
Doji
Type : Neutral
Timeframe : 1 hour
| S3 | S2 | S1 | Price | R1 | R2 | R3 | |
|---|---|---|---|---|---|---|---|
| ProTrendLines | 521.24 | 531.46 | 538.52 | 540.36 | 546.73 | 556.22 | 564.86 |
| Change (%) | -3.54% | -1.65% | -0.34% | - | +1.18% | +2.94% | +4.53% |
| Change | -19.12 | -8.90 | -1.84 | - | +6.37 | +15.86 | +24.50 |
| Level | Major | Minor | Minor | - | Intermediate | Intermediate | Major |
To determine price objectives, it is also possible to use the pivot points. Here is the price position in relation to pivot points:
| Pivot points | S3 | S2 | S1 | PP | R1 | R2 | R3 |
|---|---|---|---|---|---|---|---|
| Standard | 523.84 | 531.64 | 536.00 | 543.80 | 548.16 | 555.96 | 560.32 |
| Camarilla | 537.02 | 538.13 | 539.25 | 540.36 | 541.48 | 542.59 | 543.70 |
| Woodie | 522.12 | 530.78 | 534.28 | 542.94 | 546.44 | 555.10 | 558.60 |
| Fibonacci | 531.64 | 536.29 | 539.16 | 543.80 | 548.45 | 551.32 | 555.96 |
| Pivot points | S3 | S2 | S1 | PP | R1 | R2 | R3 |
|---|---|---|---|---|---|---|---|
| Standard | 511.56 | 525.50 | 532.93 | 546.87 | 554.30 | 568.24 | 575.67 |
| Camarilla | 534.48 | 536.44 | 538.40 | 540.36 | 542.32 | 544.28 | 546.24 |
| Woodie | 508.31 | 523.87 | 529.68 | 545.24 | 551.05 | 566.61 | 572.42 |
| Fibonacci | 525.50 | 533.66 | 538.71 | 546.87 | 555.03 | 560.08 | 568.24 |
| Pivot points | S3 | S2 | S1 | PP | R1 | R2 | R3 |
|---|---|---|---|---|---|---|---|
| Standard | 473.97 | 492.12 | 527.90 | 546.05 | 581.83 | 599.98 | 635.76 |
| Camarilla | 548.85 | 553.79 | 558.74 | 563.68 | 568.62 | 573.57 | 578.51 |
| Woodie | 482.79 | 496.53 | 536.72 | 550.46 | 590.65 | 604.39 | 644.58 |
| Fibonacci | 492.12 | 512.72 | 525.45 | 546.05 | 566.65 | 579.38 | 599.98 |
Numerical data
The following is the status of technical indicators and moving averages registered at the time this technical analysis was created:
| RSI (14): | 26.26 | |
| MACD (12,26,9): | -4.0300 | |
| Directional Movement: | -16.37 | |
| AROON (14): | -78.57 | |
| DEMA (21): | 541.71 | |
| Parabolic SAR (0,02-0,02-0,2): | 548.98 | |
| Elder Ray (13): | -3.78 | |
| Super Trend (3,10): | 548.54 | |
| Zig ZAG (10): | 540.43 | |
| VORTEX (21): | 0.8300 | |
| Stochastique (14,3,5): | 6.95 | |
| TEMA (21): | 539.83 | |
| Williams %R (14): | -93.11 | |
| Chande Momentum Oscillator (20): | -9.96 | |
| Repulse (5,40,3): | -0.4900 | |
| ROCnROLL: | 2 | |
| TRIX (15,9): | -0.0900 | |
| Courbe Coppock: | 3.23 |
| MA7: | 553.33 | |
| MA20: | 552.62 | |
| MA50: | 549.04 | |
| MA100: | 535.80 | |
| MAexp7: | 542.16 | |
| MAexp20: | 546.73 | |
| MAexp50: | 551.63 | |
| MAexp100: | 552.65 | |
| Price / MA7: | -2.34% | |
| Price / MA20: | -2.22% | |
| Price / MA50: | -1.58% | |
| Price / MA100: | +0.85% | |
| Price / MAexp7: | -0.32% | |
| Price / MAexp20: | -1.15% | |
| Price / MAexp50: | -2.03% | |
| Price / MAexp100: | -2.21% |
About author

Online


Add a comment
Comments
0 comments on the analysis SPDR S&P 500 - 1H