| Open: | - |
| Change: | - |
| Volume: | - |
| Low: | - |
| High: | - |
| High / Low range: | - |
| Type: | ETF |
| Ticker: | SLV |
| ISIN: |
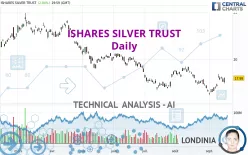
ISHARES SILVER TRUST - Daily - Technical analysis published on 09/17/2022 (GMT)
- 134
- 0
- 09/17/2022 - 00:46
- Timeframe : Daily
- - Analysis generated on 09/17/2022 - 00:46
- Status : NEUTRAL

Summary of the analysis

Additional analysis
Quotes
ISHARES SILVER TRUST rating 17.99 USD. The price has increased by +2.04% since the last closing with the lowest point at 17.45 USD and the highest point at 18.08 USD. The deviation from the price is +3.09% for the low point and -0.50% for the high point.The Central Gaps scanner detects the formation of a bearish gap marking the strong presence of sellers ahead of buyers at the opening. This formed a quotation gap.
Opening Gap DOWN
Type : Bearish
Timeframe : Openning
Here is a more detailed summary of the historical variations registered by ISHARES SILVER TRUST:
Near a new HIGH record (1 month)
Type : Bullish
Timeframe : Weekly
Technical
Technical analysis of this Daily chart of ISHARES SILVER TRUST indicates that the overall trend is slightly bearish. 53.57% of the signals given by moving averages are bearish. Caution: the slightly bullish signals currently given by short-term moving averages could cause a reversal of the trend. An assessment of moving averages reveals several bullish signals that could impact this trend:
Bullish price crossover with Moving Average 50
Type : Bullish
Timeframe : Daily
Bullish price crossover with adaptative moving average 50
Type : Bullish
Timeframe : Daily
An assessment of technical indicators shows a moderate bullish signal.
Caution: the Central Indicators scanner currently detects an excess:
Williams %R indicator is overbought : over -20
Type : Neutral
Timeframe : Daily
Pivot points : price is over resistance 1
Type : Neutral
Timeframe : Daily
Pivot points : price is over resistance 2
Type : Neutral
Timeframe : Weekly
An analysis of the price chart with the Central Patterns scanner (detector of chart patterns and resistances and supports) shows a result that can have an impact on the price change:
Horizontal resistance is broken
Type : Bullish
Timeframe : Daily
For a small rebound in the very short term, the Central Candlesticks scanner currently notes the presence of this bullish pattern in Japanese candlesticks:
Bullish engulfing lines
Type : Bullish
Timeframe : Daily
| S3 | S2 | S1 | Price | R1 | R2 | R3 | |
|---|---|---|---|---|---|---|---|
| ProTrendLines | 14.78 | 16.99 | 17.75 | 17.99 | 19.72 | 20.72 | 22.26 |
| Change (%) | -17.84% | -5.56% | -1.33% | - | +9.62% | +15.18% | +23.74% |
| Change | -3.21 | -1.00 | -0.24 | - | +1.73 | +2.73 | +4.27 |
| Level | Major | Major | Major | - | Major | Minor | Intermediate |
Attention could also be paid to pivot points to set price objectives:
| Pivot points | S3 | S2 | S1 | PP | R1 | R2 | R3 |
|---|---|---|---|---|---|---|---|
| Standard | 16.97 | 17.21 | 17.60 | 17.84 | 18.23 | 18.47 | 18.86 |
| Camarilla | 17.82 | 17.88 | 17.93 | 17.99 | 18.05 | 18.11 | 18.16 |
| Woodie | 17.05 | 17.25 | 17.68 | 17.88 | 18.31 | 18.51 | 18.94 |
| Fibonacci | 17.21 | 17.45 | 17.60 | 17.84 | 18.08 | 18.23 | 18.47 |
| Pivot points | S3 | S2 | S1 | PP | R1 | R2 | R3 |
|---|---|---|---|---|---|---|---|
| Standard | 16.50 | 16.98 | 17.48 | 17.96 | 18.46 | 18.94 | 19.44 |
| Camarilla | 17.72 | 17.81 | 17.90 | 17.99 | 18.08 | 18.17 | 18.26 |
| Woodie | 16.52 | 16.99 | 17.50 | 17.97 | 18.48 | 18.95 | 19.46 |
| Fibonacci | 16.98 | 17.35 | 17.58 | 17.96 | 18.33 | 18.56 | 18.94 |
| Pivot points | S3 | S2 | S1 | PP | R1 | R2 | R3 |
|---|---|---|---|---|---|---|---|
| Standard | 13.06 | 14.82 | 15.70 | 17.46 | 18.34 | 20.10 | 20.98 |
| Camarilla | 15.85 | 16.10 | 16.34 | 16.58 | 16.82 | 17.06 | 17.31 |
| Woodie | 12.62 | 14.60 | 15.26 | 17.24 | 17.90 | 19.88 | 20.54 |
| Fibonacci | 14.82 | 15.83 | 16.45 | 17.46 | 18.47 | 19.09 | 20.10 |
Numerical data
The following is the status of the technical indicators and moving averages at the time of publication of this technical analysis:
| RSI (14): | 54.77 | |
| MACD (12,26,9): | -0.0600 | |
| Directional Movement: | -0.07 | |
| AROON (14): | 42.86 | |
| DEMA (21): | 17.42 | |
| Parabolic SAR (0,02-0,02-0,2): | 16.73 | |
| Elder Ray (13): | 0.21 | |
| Super Trend (3,10): | 16.87 | |
| Zig ZAG (10): | 17.99 | |
| VORTEX (21): | 0.8300 | |
| Stochastique (14,3,5): | 74.98 | |
| TEMA (21): | 17.59 | |
| Williams %R (14): | -19.82 | |
| Chande Momentum Oscillator (20): | 1.03 | |
| Repulse (5,40,3): | 0.9200 | |
| ROCnROLL: | -1 | |
| TRIX (15,9): | -0.1800 | |
| Courbe Coppock: | 2.43 |
| MA7: | 17.71 | |
| MA20: | 17.33 | |
| MA50: | 17.75 | |
| MA100: | 18.85 | |
| MAexp7: | 17.69 | |
| MAexp20: | 17.57 | |
| MAexp50: | 17.98 | |
| MAexp100: | 18.83 | |
| Price / MA7: | +1.58% | |
| Price / MA20: | +3.81% | |
| Price / MA50: | +1.35% | |
| Price / MA100: | -4.56% | |
| Price / MAexp7: | +1.70% | |
| Price / MAexp20: | +2.39% | |
| Price / MAexp50: | +0.06% | |
| Price / MAexp100: | -4.46% |
About author

Online


Add a comment
Comments
0 comments on the analysis ISHARES SILVER TRUST - Daily