BENETEAU - Daily - Technical analysis published on 07/10/2024 (GMT)
- 124
- 0
Click here for a new analysis!
- Timeframe : Daily
- - Analysis generated on
- Status : TARGET REACHED
Summary of the analysis

Additional analysis
Quotes
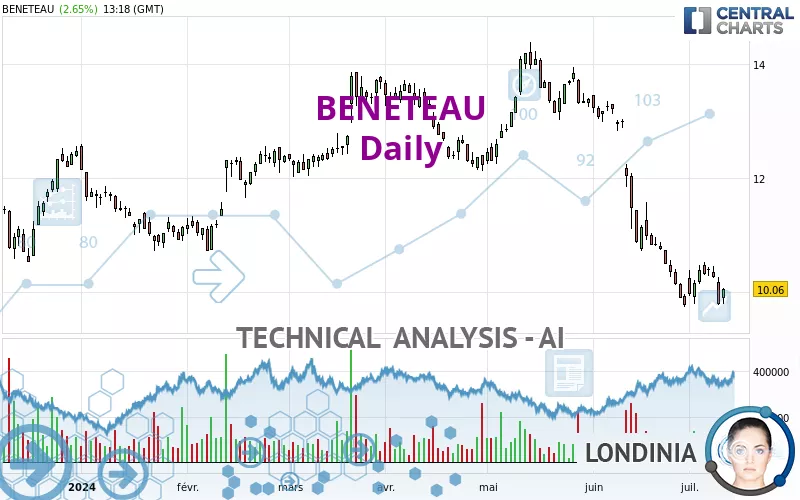
The BENETEAU rating is 10.06 EUR. On the day, this instrument gained +2.65% and was between 9.79 EUR and 10.08 EUR. This implies that the price is at +2.76% from its lowest and at -0.20% from its highest.The Central Gaps scanner detects a bullish opening. A small advantage for buyers in the very short term.
Bullish opening
Type : Bullish
Timeframe : Openning
Here is a more detailed summary of the historical variations registered by BENETEAU:
Near a new LOW record (1 year)
Type : Bearish
Timeframe : Weekly
Near a new LOW record (1st january)
Type : Bearish
Timeframe : Weekly
Near a new LOW record (1 month)
Type : Bearish
Timeframe : Weekly
Technical
Technical analysis of BENETEAU in Daily shows a overall strongly bearish trend. The signals given by moving averages are 92.86% bearish. This strong bearish trend is confirmed by the strong signals currently being given by short-term moving averages. There is no crossing of moving average by the price or crossing of moving averages between themselves.
An assessment of technical indicators does not currently provide any relevant information on the direction of future price movements.
But beware of excesses. The Central Indicators scanner currently detects this:
MACD indicator: bullish divergence
Type : Bullish
Timeframe : Daily
RSI indicator: bullish divergence
Type : Bullish
Timeframe : Daily
Price is back over the pivot point
Type : Bullish
Timeframe : Daily
Price is back under the pivot point
Type : Bearish
Timeframe : Weekly
An analysis of the price chart with the Central Patterns scanner (detector of chart patterns and resistances and supports) shows a result that can have an impact on the price change:
Near horizontal support
Type : Bullish
Timeframe : Daily
The presence of a bullish Japanese candlestick pattern detected by Central Candlesticks that could cause a very short term rebound was also detected:
Bullish harami
Type : Bullish
Timeframe : Daily
| S3 | S2 | S1 | Price | R1 | R2 | R3 | |
|---|---|---|---|---|---|---|---|
| ProTrendLines | 6.49 | 8.71 | 9.94 | 10.06 | 10.39 | 10.82 | 11.10 |
| Change (%) | -35.49% | -13.42% | -1.19% | - | +3.28% | +7.55% | +10.34% |
| Change | -3.57 | -1.35 | -0.12 | - | +0.33 | +0.76 | +1.04 |
| Level | Minor | Major | Major | - | Major | Minor | Intermediate |
Pivot points can also be used to set your price objectives. Here is the price situation in relation to pivot points:
| Pivot points | S3 | S2 | S1 | PP | R1 | R2 | R3 |
|---|---|---|---|---|---|---|---|
| Standard | 9.14 | 9.45 | 9.63 | 9.94 | 10.12 | 10.43 | 10.61 |
| Camarilla | 9.67 | 9.71 | 9.76 | 9.80 | 9.85 | 9.89 | 9.94 |
| Woodie | 9.07 | 9.42 | 9.56 | 9.91 | 10.05 | 10.40 | 10.54 |
| Fibonacci | 9.45 | 9.64 | 9.76 | 9.94 | 10.13 | 10.25 | 10.43 |
| Pivot points | S3 | S2 | S1 | PP | R1 | R2 | R3 |
|---|---|---|---|---|---|---|---|
| Standard | 9.23 | 9.51 | 9.95 | 10.23 | 10.67 | 10.95 | 11.39 |
| Camarilla | 10.18 | 10.25 | 10.31 | 10.38 | 10.45 | 10.51 | 10.58 |
| Woodie | 9.30 | 9.55 | 10.02 | 10.27 | 10.74 | 10.99 | 11.46 |
| Fibonacci | 9.51 | 9.79 | 9.96 | 10.23 | 10.51 | 10.68 | 10.95 |
| Pivot points | S3 | S2 | S1 | PP | R1 | R2 | R3 |
|---|---|---|---|---|---|---|---|
| Standard | 5.80 | 7.77 | 8.77 | 10.74 | 11.74 | 13.71 | 14.71 |
| Camarilla | 8.95 | 9.23 | 9.50 | 9.77 | 10.04 | 10.32 | 10.59 |
| Woodie | 5.32 | 7.53 | 8.29 | 10.50 | 11.26 | 13.47 | 14.23 |
| Fibonacci | 7.77 | 8.91 | 9.61 | 10.74 | 11.88 | 12.58 | 13.71 |
Numerical data
The following are the details of the technical indicators and moving averages that were collected to generate this technical analysis:
| RSI (14): | 35.66 | |
| MACD (12,26,9): | -0.4900 | |
| Directional Movement: | -21.09 | |
| AROON (14): | -42.86 | |
| DEMA (21): | 9.90 | |
| Parabolic SAR (0,02-0,02-0,2): | 10.51 | |
| Elder Ray (13): | -0.38 | |
| Super Trend (3,10): | 10.78 | |
| Zig ZAG (10): | 10.06 | |
| VORTEX (21): | 0.6600 | |
| Stochastique (14,3,5): | 24.33 | |
| TEMA (21): | 9.75 | |
| Williams %R (14): | -71.93 | |
| Chande Momentum Oscillator (20): | -0.44 | |
| Repulse (5,40,3): | -2.1000 | |
| ROCnROLL: | 2 | |
| TRIX (15,9): | -0.6900 | |
| Courbe Coppock: | 15.16 |
| MA7: | 10.19 | |
| MA20: | 10.44 | |
| MA50: | 11.71 | |
| MA100: | 11.89 | |
| MAexp7: | 10.14 | |
| MAexp20: | 10.57 | |
| MAexp50: | 11.26 | |
| MAexp100: | 11.57 | |
| Price / MA7: | -1.28% | |
| Price / MA20: | -3.64% | |
| Price / MA50: | -14.09% | |
| Price / MA100: | -15.39% | |
| Price / MAexp7: | -0.79% | |
| Price / MAexp20: | -4.82% | |
| Price / MAexp50: | -10.66% | |
| Price / MAexp100: | -13.05% |
News
The latest news and videos published on BENETEAU at the time of the analysis were as follows:
- Groupe Beneteau looks to IFS for its new ERP mainstay
- Groupe Beneteau looks to IFS for its new ERP mainstay
- Groupe Beneteau looks to IFS for its new ERP mainstay
-
 Beneteau
About author
Online


Add a comment
Comments
0 comments on the analysis BENETEAU - Daily