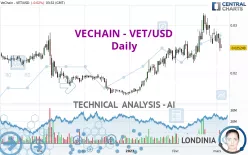
VECHAIN - VET/USD - Daily - Technical analysis published on 03/04/2023 (GMT)
- 192
- 0
Click here for a new analysis!
- Timeframe : Daily
- - Analysis generated on
- Status : INVALID

Summary of the analysis

Additional analysis
Quotes
The VECHAIN - VET/USD rating is 0.025249 USD. The price is lower by -0.02% since the last closing with the lowest point at 0.025237 USD and the highest point at 0.025959 USD. The deviation from the price is +0.05% for the low point and -2.74% for the high point.A bullish opening was detected by the Central Gaps scanner. Buyers are trying to impose a bullish momentum in the very short term.
Bullish opening
Type : Bullish
Timeframe : Openning
A study of price movements over other periods shows the following variations:
Technical
Technical analysis of this Daily chart of VECHAIN - VET/USD indicates that the overall trend is bullish. 75.00% of the signals given by moving averages are bullish. Caution: the neutral signals currently given by short-term moving averages show us that the global trend is losing momentum. The Central Indicators market scanner is currently detecting a bearish signal that could impact this trend:
Bearish trend reversal : adaptative moving average 20
Type : Bearish
Timeframe : Daily
In fact, according to the parameters integrated into the Central Analyzer system, only 9 technical indicators out of 18 analysed are currently bearish. Caution: the Central Indicators scanner currently detects an excess:
Williams %R indicator is oversold : under -80
Type : Neutral
Timeframe : Daily
Aroon indicator bearish trend
Type : Bearish
Timeframe : Daily
Ichimoku - Bearish crossover : Tenkan & Kijun
Type : Bearish
Timeframe : Daily
The analysis of the price chart with Central Patterns scanners does not return any result.
The Central Candlesticks scanner currently notes the presence of this pattern in Japanese candlesticks that could mark the end of the short-term trend currently underway:
Doji
Type : Neutral
Timeframe : Daily
| S3 | S2 | S1 | Price | R1 | R2 | R3 | |
|---|---|---|---|---|---|---|---|
| ProTrendLines | 0.015637 | 0.017653 | 0.022892 | 0.025249 | 0.026870 | 0.032033 | 0.083713 |
| Change (%) | -38.07% | -30.08% | -9.34% | - | +6.42% | +26.87% | +231.55% |
| Change | -0.009612 | -0.007596 | -0.002357 | - | +0.001621 | +0.006784 | +0.058464 |
| Level | Minor | Minor | Major | - | Intermediate | Major | Minor |
To determine price objectives, it is also possible to use the pivot points. Here is the price position in relation to pivot points:
| Pivot points | S3 | S2 | S1 | PP | R1 | R2 | R3 |
|---|---|---|---|---|---|---|---|
| Standard | 0.021136 | 0.022844 | 0.024048 | 0.025756 | 0.026960 | 0.028668 | 0.029872 |
| Camarilla | 0.024452 | 0.024719 | 0.024986 | 0.025253 | 0.025520 | 0.025787 | 0.026054 |
| Woodie | 0.020885 | 0.022718 | 0.023797 | 0.025630 | 0.026709 | 0.028542 | 0.029621 |
| Fibonacci | 0.022844 | 0.023956 | 0.024643 | 0.025756 | 0.026868 | 0.027555 | 0.028668 |
| Pivot points | S3 | S2 | S1 | PP | R1 | R2 | R3 |
|---|---|---|---|---|---|---|---|
| Standard | 0.018129 | 0.022255 | 0.024317 | 0.028443 | 0.030505 | 0.034631 | 0.036693 |
| Camarilla | 0.024678 | 0.025246 | 0.025813 | 0.026380 | 0.026947 | 0.027515 | 0.028082 |
| Woodie | 0.017098 | 0.021739 | 0.023286 | 0.027927 | 0.029474 | 0.034115 | 0.035662 |
| Fibonacci | 0.022255 | 0.024619 | 0.026079 | 0.028443 | 0.030807 | 0.032267 | 0.034631 |
| Pivot points | S3 | S2 | S1 | PP | R1 | R2 | R3 |
|---|---|---|---|---|---|---|---|
| Standard | 0.011157 | 0.016597 | 0.021689 | 0.027129 | 0.032221 | 0.037661 | 0.042753 |
| Camarilla | 0.023886 | 0.024851 | 0.025817 | 0.026782 | 0.027747 | 0.028713 | 0.029678 |
| Woodie | 0.010984 | 0.016510 | 0.021516 | 0.027042 | 0.032048 | 0.037574 | 0.042580 |
| Fibonacci | 0.016597 | 0.020620 | 0.023105 | 0.027129 | 0.031152 | 0.033637 | 0.037661 |
Numerical data
The following is the status of the technical indicators and moving averages at the time of publication of this technical analysis:
| RSI (14): | 47.11 | |
| MACD (12,26,9): | 0.0006 | |
| Directional Movement: | 1.179414 | |
| AROON (14): | -78.571429 | |
| DEMA (21): | 0.027837 | |
| Parabolic SAR (0,02-0,02-0,2): | 0.032126 | |
| Elder Ray (13): | -0.001406 | |
| Super Trend (3,10): | 0.023446 | |
| Zig ZAG (10): | 0.025474 | |
| VORTEX (21): | 1.0381 | |
| Stochastique (14,3,5): | 17.88 | |
| TEMA (21): | 0.027131 | |
| Williams %R (14): | -91.38 | |
| Chande Momentum Oscillator (20): | -0.006791 | |
| Repulse (5,40,3): | -8.4185 | |
| ROCnROLL: | -1 | |
| TRIX (15,9): | 0.6443 | |
| Courbe Coppock: | 3.91 |
| MA7: | 0.027034 | |
| MA20: | 0.027251 | |
| MA50: | 0.024801 | |
| MA100: | 0.021213 | |
| MAexp7: | 0.026651 | |
| MAexp20: | 0.026785 | |
| MAexp50: | 0.024857 | |
| MAexp100: | 0.023230 | |
| Price / MA7: | -6.60% | |
| Price / MA20: | -7.35% | |
| Price / MA50: | +1.81% | |
| Price / MA100: | +19.03% | |
| Price / MAexp7: | -5.26% | |
| Price / MAexp20: | -5.73% | |
| Price / MAexp50: | +1.58% | |
| Price / MAexp100: | +8.69% |
About author
Online


Add a comment
Comments
0 comments on the analysis VECHAIN - VET/USD - Daily