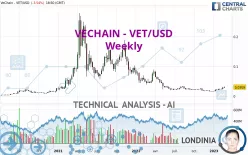
VECHAIN - VET/USD - Weekly - Technical analysis published on 02/21/2023 (GMT)
- 192
- 0
Click here for a new analysis!
- Timeframe : Weekly
- - Analysis generated on
- Status : TARGET REACHED

Summary of the analysis

Additional analysis
Quotes
The VECHAIN - VET/USD price is 0.030900 USD. Over 5 days, this instrument gained +20.70% and was traded between 0.024314 USD and 0.032277 USD over the period. The price is currently at +27.09% from its lowest point and -4.27% from its highest point.The Central Gaps scanner detects a bearish opening. A small advantage for sellers in the very short term.
Bearish opening
Type : Bearish
Timeframe : Openning
Here is a more detailed summary of the historical variations registered by VECHAIN - VET/USD:
Near a new HIGH record (1st january)
Type : Bullish
Timeframe : Weekly
Near a new HIGH record (1 month)
Type : Bullish
Timeframe : Weekly
Abnormal volumes on VECHAIN - VET/USD were detected by the Central Volumes scanner:
Abnormal volumes
Timeframe : 5 days
Technical
Technical analysis of VECHAIN - VET/USD in Weekly shows an overall bearish trend. 67.86% of the signals given by moving averages are bearish. Caution: the slightly bullish signals currently being given by short-term moving averages indicate that this bearish trend may be slowing down. The Central Indicators scanner detects a bullish signal on moving averages that could impact this trend:
Bullish price crossover with Moving Average 50
Type : Bullish
Timeframe : Weekly
The probability of a further increase is high given the direction of the technical indicators.
But beware of excesses. The Central Indicators scanner currently detects this:
CCI indicator is overbought : over 100
Type : Neutral
Timeframe : Weekly
Williams %R indicator is overbought : over -20
Type : Neutral
Timeframe : Weekly
Pivot points : price is over resistance 1
Type : Neutral
Timeframe : Weekly
No signals are given by Central Patterns, a market scanner specialised in chart patterns, resistances and supports.
The Central Candlesticks scanner, specialised in Japanese candlesticks, did not identify any signals.
| S1 | Price | R1 | R2 | R3 | |
|---|---|---|---|---|---|
| ProTrendLines | 0.026870 | 0.030900 | 0.057700 | 0.083713 | 0.175610 |
| Change (%) | -13.04% | - | +86.73% | +170.92% | +468.32% |
| Change | -0.004030 | - | +0.026800 | +0.052813 | +0.144710 |
| Level | Major | - | Minor | Minor | Intermediate |
Pivot points can also be used to set your price objectives. Here is the price situation in relation to pivot points:
| Pivot points | S3 | S2 | S1 | PP | R1 | R2 | R3 |
|---|---|---|---|---|---|---|---|
| Standard | 0.025363 | 0.026911 | 0.029472 | 0.031020 | 0.033581 | 0.035129 | 0.037690 |
| Camarilla | 0.030903 | 0.031280 | 0.031656 | 0.032033 | 0.032410 | 0.032786 | 0.033163 |
| Woodie | 0.025870 | 0.027164 | 0.029979 | 0.031273 | 0.034088 | 0.035382 | 0.038197 |
| Fibonacci | 0.026911 | 0.028481 | 0.029450 | 0.031020 | 0.032590 | 0.033559 | 0.035129 |
| Pivot points | S3 | S2 | S1 | PP | R1 | R2 | R3 |
|---|---|---|---|---|---|---|---|
| Standard | 0.016693 | 0.019396 | 0.023252 | 0.025955 | 0.029811 | 0.032514 | 0.036370 |
| Camarilla | 0.025304 | 0.025906 | 0.026507 | 0.027108 | 0.027709 | 0.028311 | 0.028912 |
| Woodie | 0.017270 | 0.019684 | 0.023829 | 0.026243 | 0.030388 | 0.032802 | 0.036947 |
| Fibonacci | 0.019396 | 0.021902 | 0.023450 | 0.025955 | 0.028461 | 0.030009 | 0.032514 |
| Pivot points | S3 | S2 | S1 | PP | R1 | R2 | R3 |
|---|---|---|---|---|---|---|---|
| Standard | 0.007977 | 0.011842 | 0.017488 | 0.021353 | 0.026999 | 0.030864 | 0.036510 |
| Camarilla | 0.020520 | 0.021391 | 0.022263 | 0.023135 | 0.024007 | 0.024879 | 0.025751 |
| Woodie | 0.008869 | 0.012287 | 0.018380 | 0.021798 | 0.027891 | 0.031309 | 0.037402 |
| Fibonacci | 0.011842 | 0.015475 | 0.017720 | 0.021353 | 0.024986 | 0.027231 | 0.030864 |
Numerical data
The following are the details of the technical indicators and moving averages that were collected to generate this technical analysis:
| RSI (14): | 60.87 | |
| MACD (12,26,9): | -0.0010 | |
| Directional Movement: | 13.691202 | |
| AROON (14): | 57.142857 | |
| DEMA (21): | 0.020833 | |
| Parabolic SAR (0,02-0,02-0,2): | 0.019305 | |
| Elder Ray (13): | 0.006178 | |
| Super Trend (3,10): | 0.017565 | |
| Zig ZAG (10): | 0.031036 | |
| VORTEX (21): | 1.0725 | |
| Stochastique (14,3,5): | 80.99 | |
| TEMA (21): | 0.026247 | |
| Williams %R (14): | -9.66 | |
| Chande Momentum Oscillator (20): | 0.011547 | |
| Repulse (5,40,3): | 27.4908 | |
| ROCnROLL: | -1 | |
| TRIX (15,9): | -1.6381 | |
| Courbe Coppock: | 42.04 |
| MA7: | 0.028073 | |
| MA20: | 0.025577 | |
| MA50: | 0.022615 | |
| MA100: | 0.020281 | |
| MAexp7: | 0.025302 | |
| MAexp20: | 0.023566 | |
| MAexp50: | 0.033520 | |
| MAexp100: | 0.064641 | |
| Price / MA7: | +10.07% | |
| Price / MA20: | +20.81% | |
| Price / MA50: | +36.63% | |
| Price / MA100: | +52.36% | |
| Price / MAexp7: | +22.12% | |
| Price / MAexp20: | +31.12% | |
| Price / MAexp50: | -7.82% | |
| Price / MAexp100: | -52.20% |
About author

Online


Add a comment
Comments
0 comments on the analysis VECHAIN - VET/USD - Weekly