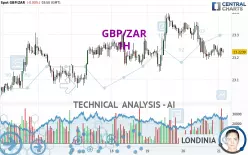
GBP/ZAR - 1H - Technical analysis published on 02/21/2025 (GMT)
- 94
- 0
Click here for a new analysis!
- Timeframe : 1H
- - Analysis generated on
- Status : INVALID

Summary of the analysis

Additional analysis
Quotes
GBP/ZAR rating 23.2239 ZAR. On the day, this instrument gained +0.00% with the lowest point at 23.1988 ZAR and the highest point at 23.2423 ZAR. The deviation from the price is +0.11% for the low point and -0.08% for the high point.A bearish opening was detected by the Central Gaps scanner. Sellers are trying to impose a bearish trend in the very short term.
Bearish opening
Type : Bearish
Timeframe : Openning
Here is a more detailed summary of the historical variations registered by GBP/ZAR:
Near a new HIGH record (1 year)
Type : Bullish
Timeframe : Weekly
Near a new HIGH record (1st january)
Type : Bullish
Timeframe : Weekly
Near a new LOW record (1 month)
Type : Bearish
Timeframe : Weekly
Technical
Technical analysis of this 1H chart of GBP/ZAR indicates that the overall trend is slightly bearish. 60.71% of the signals given by moving averages are bearish. The overall trend could accelerate as a result of the strong bearish signals from short-term moving averages. The Central Indicators scanner does not detect any result on moving averages that would impact this trend.
An assessment of technical indicators does not currently provide any relevant information to suggest whether the signal given by the technical indicators is more bullish or bearish.
Central Indicators, the detector scanner for these technical indicators recently detected a signal:
MACD crosses UP its Moving Average
Type : Bullish
Timeframe : 1 hour
The Central Patterns scanner, which studies chart patterns, resistances and supports, has identified these signals:
Near horizontal support
Type : Bullish
Timeframe : 1 hour
Support of channel is broken
Type : Bearish
Timeframe : 1 hour
There is also a Japanese candlestick pattern detected by Central Candlesticks that could mark the end of the current short-term trend:
Doji
Type : Neutral
Timeframe : 1 hour
| S3 | S2 | S1 | Price | R1 | R2 | R3 | |
|---|---|---|---|---|---|---|---|
| ProTrendLines | 22.9182 | 23.0653 | 23.1731 | 23.2239 | 23.2482 | 23.3583 | 23.6559 |
| Change (%) | -1.32% | -0.68% | -0.22% | - | +0.10% | +0.58% | +1.86% |
| Change | -0.3057 | -0.1586 | -0.0508 | - | +0.0243 | +0.1344 | +0.4320 |
| Level | Minor | Major | Major | - | Minor | Major | Intermediate |
Attention could also be paid to pivot points to set price objectives:
| Pivot points | S3 | S2 | S1 | PP | R1 | R2 | R3 |
|---|---|---|---|---|---|---|---|
| Standard | 22.9846 | 23.0864 | 23.1555 | 23.2573 | 23.3264 | 23.4282 | 23.4973 |
| Camarilla | 23.1777 | 23.1934 | 23.2090 | 23.2247 | 23.2404 | 23.2560 | 23.2717 |
| Woodie | 22.9684 | 23.0782 | 23.1393 | 23.2491 | 23.3102 | 23.4200 | 23.4811 |
| Fibonacci | 23.0864 | 23.1517 | 23.1920 | 23.2573 | 23.3226 | 23.3629 | 23.4282 |
| Pivot points | S3 | S2 | S1 | PP | R1 | R2 | R3 |
|---|---|---|---|---|---|---|---|
| Standard | 22.2551 | 22.5025 | 22.8147 | 23.0621 | 23.3743 | 23.6217 | 23.9339 |
| Camarilla | 22.9729 | 23.0242 | 23.0755 | 23.1268 | 23.1781 | 23.2294 | 23.2807 |
| Woodie | 22.2874 | 22.5187 | 22.8470 | 23.0783 | 23.4066 | 23.6379 | 23.9662 |
| Fibonacci | 22.5025 | 22.7163 | 22.8484 | 23.0621 | 23.2759 | 23.4080 | 23.6217 |
| Pivot points | S3 | S2 | S1 | PP | R1 | R2 | R3 |
|---|---|---|---|---|---|---|---|
| Standard | 21.7949 | 22.2534 | 22.7013 | 23.1598 | 23.6077 | 24.0662 | 24.5141 |
| Camarilla | 22.9000 | 22.9831 | 23.0662 | 23.1493 | 23.2324 | 23.3155 | 23.3986 |
| Woodie | 21.7897 | 22.2508 | 22.6961 | 23.1572 | 23.6025 | 24.0636 | 24.5089 |
| Fibonacci | 22.2534 | 22.5996 | 22.8135 | 23.1598 | 23.5060 | 23.7199 | 24.0662 |
Numerical data
The following is the status of the technical indicators and moving averages at the time of publication of this technical analysis:
| RSI (14): | 44.02 | |
| MACD (12,26,9): | -0.0165 | |
| Directional Movement: | -5.8572 | |
| AROON (14): | -21.4286 | |
| DEMA (21): | 23.2220 | |
| Parabolic SAR (0,02-0,02-0,2): | 23.1960 | |
| Elder Ray (13): | -0.0057 | |
| Super Trend (3,10): | 23.3332 | |
| Zig ZAG (10): | 23.2247 | |
| VORTEX (21): | 0.9284 | |
| Stochastique (14,3,5): | 43.17 | |
| TEMA (21): | 23.2090 | |
| Williams %R (14): | -61.44 | |
| Chande Momentum Oscillator (20): | 0.0085 | |
| Repulse (5,40,3): | 0.0105 | |
| ROCnROLL: | 2 | |
| TRIX (15,9): | -0.0114 | |
| Courbe Coppock: | 0.33 |
| MA7: | 23.2297 | |
| MA20: | 23.1507 | |
| MA50: | 23.1287 | |
| MA100: | 23.0079 | |
| MAexp7: | 23.2269 | |
| MAexp20: | 23.2432 | |
| MAexp50: | 23.2544 | |
| MAexp100: | 23.2289 | |
| Price / MA7: | -0.02% | |
| Price / MA20: | +0.32% | |
| Price / MA50: | +0.41% | |
| Price / MA100: | +0.94% | |
| Price / MAexp7: | -0.01% | |
| Price / MAexp20: | -0.08% | |
| Price / MAexp50: | -0.13% | |
| Price / MAexp100: | -0.02% |
About author
Online


Add a comment
Comments
0 comments on the analysis GBP/ZAR - 1H