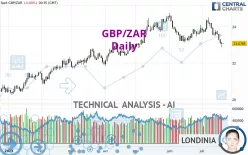
GBP/ZAR - Daily - Technical analysis published on 07/21/2023 (GMT)
- 163
- 0
Click here for a new analysis!
- Timeframe : Daily
- - Analysis generated on
- Status : INVALID

Summary of the analysis

Additional analysis
Quotes
The GBP/ZAR rating is 23.0782 ZAR. The price registered an increase of +0.00% on the session and was traded between 23.0704 ZAR and 23.0950 ZAR over the period. The price is currently at +0.03% from its lowest and -0.07% from its highest.The Central Gaps scanner detects a bullish opening. A small advantage for buyers in the very short term.
Bullish opening
Type : Bullish
Timeframe : Openning
A study of price movements over other periods shows the following variations:
Near a new HIGH record (5 years)
Type : Bullish
Timeframe : Weekly
Near a new LOW record (1 month)
Type : Bearish
Timeframe : Weekly
Technical
Technical analysis of GBP/ZAR in Daily shows an overall bearish trend. 64.29% of the signals given by moving averages are bearish. The overall trend is reinforced by the strong bearish signals from short-term moving averages. There is no crossing of moving average by the price or crossing of moving averages between themselves.
In fact, 11 technical indicators on 18 studied are currently positioned bearish. Caution: the Central Indicators scanner currently detects an excess:
CCI indicator is oversold : under -100
Type : Neutral
Timeframe : Daily
Williams %R indicator is oversold : under -80
Type : Neutral
Timeframe : Daily
Pivot points : price is under support 1
Type : Neutral
Timeframe : Weekly
The Central Patterns scanner, which studies chart patterns, resistances and supports, has identified this signal:
Support of channel is broken
Type : Bearish
Timeframe : Daily
Central Candlesticks, the scanner specialised in Japanese candlesticks, detects these bullish signals that could support the hypothesis of a small rebound in the very short term:
Bullish harami
Type : Bullish
Timeframe : Daily
Bullish harami cross
Type : Bullish
Timeframe : Daily
| S3 | S2 | S1 | Price | R1 | R2 | R3 | |
|---|---|---|---|---|---|---|---|
| ProTrendLines | 20.3333 | 21.7195 | 22.4355 | 23.0782 | 23.2072 | 23.6066 | 24.5070 |
| Change (%) | -11.89% | -5.89% | -2.78% | - | +0.56% | +2.29% | +6.19% |
| Change | -2.7449 | -1.3587 | -0.6427 | - | +0.1290 | +0.5284 | +1.4288 |
| Level | Intermediate | Major | Minor | - | Major | Major | Major |
Pivot points can also be used to set your price objectives. Here is the price situation in relation to pivot points:
| Pivot points | S3 | S2 | S1 | PP | R1 | R2 | R3 |
|---|---|---|---|---|---|---|---|
| Standard | 22.6653 | 22.7720 | 22.9253 | 23.0320 | 23.1853 | 23.2920 | 23.4453 |
| Camarilla | 23.0071 | 23.0309 | 23.0548 | 23.0786 | 23.1024 | 23.1263 | 23.1501 |
| Woodie | 22.6886 | 22.7837 | 22.9486 | 23.0437 | 23.2086 | 23.3037 | 23.4686 |
| Fibonacci | 22.7720 | 22.8713 | 22.9327 | 23.0320 | 23.1313 | 23.1927 | 23.2920 |
| Pivot points | S3 | S2 | S1 | PP | R1 | R2 | R3 |
|---|---|---|---|---|---|---|---|
| Standard | 22.5731 | 23.0210 | 23.3630 | 23.8109 | 24.1529 | 24.6008 | 24.9428 |
| Camarilla | 23.4878 | 23.5602 | 23.6326 | 23.7050 | 23.7774 | 23.8498 | 23.9222 |
| Woodie | 22.5202 | 22.9945 | 23.3101 | 23.7844 | 24.1000 | 24.5743 | 24.8899 |
| Fibonacci | 23.0210 | 23.3227 | 23.5092 | 23.8109 | 24.1126 | 24.2991 | 24.6008 |
| Pivot points | S3 | S2 | S1 | PP | R1 | R2 | R3 |
|---|---|---|---|---|---|---|---|
| Standard | 21.4941 | 22.3066 | 23.1159 | 23.9284 | 24.7377 | 25.5502 | 26.3595 |
| Camarilla | 23.4792 | 23.6279 | 23.7765 | 23.9252 | 24.0739 | 24.2225 | 24.3712 |
| Woodie | 21.4925 | 22.3058 | 23.1143 | 23.9276 | 24.7361 | 25.5494 | 26.3579 |
| Fibonacci | 22.3066 | 22.9261 | 23.3089 | 23.9284 | 24.5479 | 24.9307 | 25.5502 |
Numerical data
The following is the status of the technical indicators and moving averages at the time of publication of this technical analysis:
| RSI (14): | 37.01 | |
| MACD (12,26,9): | -0.1315 | |
| Directional Movement: | -11.6508 | |
| AROON (14): | -64.2857 | |
| DEMA (21): | 23.4304 | |
| Parabolic SAR (0,02-0,02-0,2): | 23.9373 | |
| Elder Ray (13): | -0.3929 | |
| Super Trend (3,10): | 23.8883 | |
| Zig ZAG (10): | 23.0899 | |
| VORTEX (21): | 0.9485 | |
| Stochastique (14,3,5): | 10.15 | |
| TEMA (21): | 23.2650 | |
| Williams %R (14): | -87.09 | |
| Chande Momentum Oscillator (20): | -0.7867 | |
| Repulse (5,40,3): | -0.8982 | |
| ROCnROLL: | 2 | |
| TRIX (15,9): | -0.0185 | |
| Courbe Coppock: | 3.82 |
| MA7: | 23.3455 | |
| MA20: | 23.6773 | |
| MA50: | 23.7755 | |
| MA100: | 23.2031 | |
| MAexp7: | 23.3151 | |
| MAexp20: | 23.5574 | |
| MAexp50: | 23.5407 | |
| MAexp100: | 23.1315 | |
| Price / MA7: | -1.14% | |
| Price / MA20: | -2.53% | |
| Price / MA50: | -2.93% | |
| Price / MA100: | -0.54% | |
| Price / MAexp7: | -1.02% | |
| Price / MAexp20: | -2.03% | |
| Price / MAexp50: | -1.96% | |
| Price / MAexp100: | -0.23% |
About author
Online


Add a comment
Comments
0 comments on the analysis GBP/ZAR - Daily