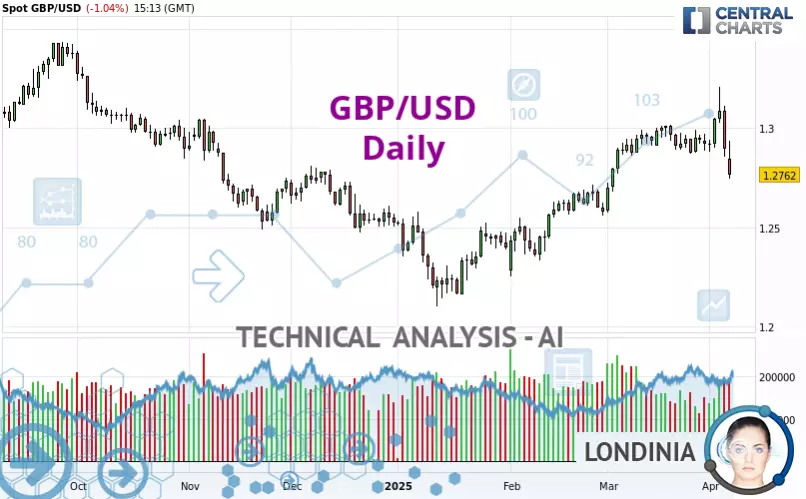
GBP/USD - Daily - Technical analysis published on 04/07/2025 (GMT)
- 147
- 0
Click here for a new analysis!
- Timeframe : Daily
- - Analysis generated on
- Status : TARGET REACHED

Summary of the analysis

Additional analysis
Quotes
The GBP/USD price is 1.2763 USD. On the day, this instrument lost -1.03% and was between 1.2746 USD and 1.2934 USD. This implies that the price is at +0.13% from its lowest and at -1.32% from its highest.The Central Gaps scanner detects the formation of a bearish gap marking the strong presence of sellers ahead of buyers at the opening. This formed a quotation gap.
Opening Gap DOWN
Type : Bearish
Timeframe : Openning
A study of price movements over other periods shows the following variations:
Near a new HIGH record (1 year)
Type : Bullish
Timeframe : Weekly
Near a new HIGH record (1st january)
Type : Bullish
Timeframe : Weekly
Near a new HIGH record (1 month)
Type : Bullish
Timeframe : Weekly
New LOW record (1 month)
Type : Bearish
Timeframe : Weekly
Technical
Technical analysis of GBP/USD in Daily shows an overall bullish trend. The signals given by moving averages are 67.86% bullish. This bullish trend could slow down given the slightly bearish signals currently being given by short-term moving averages. An assessment of moving averages reveals several bearish signals that could impact this trend:
Bearish trend reversal : Moving Average 20
Type : Bearish
Timeframe : Daily
Bearish trend reversal : adaptative moving average 20
Type : Bearish
Timeframe : Daily
Bearish price crossover with adaptative moving average 50
Type : Bearish
Timeframe : Daily
In fact, of the 18 technical indicators analysed by Central Analyzer, 4 are bullish, 9 are neutral and 5 are bearish. Caution: the Central Indicators scanner currently detects an excess:
CCI indicator is oversold : under -100
Type : Neutral
Timeframe : Daily
Williams %R indicator is oversold : under -80
Type : Neutral
Timeframe : Daily
Pivot points : price is under support 1 (Daily)
Type : Neutral
Timeframe : Daily
Pivot points : price is under support 1 (Daily)
Type : Neutral
Timeframe : Weekly
RSI indicator is back under 50
Type : Bearish
Timeframe : Daily
SuperTrend indicator bearish reversal
Type : Bearish
Timeframe : Daily
Pivot points : price is under support 1 (Weekly)
Type : Neutral
Timeframe : Daily
Price is back under the pivot point (Monthly)
Type : Bearish
Timeframe : Daily
Pivot points : price is under support 1 (Monthly)
Type : Neutral
Timeframe : Daily
An analysis of the price chart with the Central Patterns scanner (detector of chart patterns and resistances and supports) shows several results that can have an impact on the price change:
Near horizontal support
Type : Bullish
Timeframe : Daily
Support of channel is broken
Type : Bearish
Timeframe : Daily
The Central Candlesticks scanner which studies Japanese candlesticks did not detect anything.
| S3 | S2 | S1 | Price | R1 | R2 | R3 | |
|---|---|---|---|---|---|---|---|
| ProTrendLines | 1.2166 | 1.2360 | 1.2576 | 1.2763 | 1.2795 | 1.3009 | 1.3128 |
| Change (%) | -4.68% | -3.16% | -1.47% | - | +0.25% | +1.93% | +2.86% |
| Change | -0.0597 | -0.0403 | -0.0187 | - | +0.0032 | +0.0246 | +0.0365 |
| Level | Minor | Minor | Intermediate | - | Intermediate | Intermediate | Major |
To determine price objectives, it is also possible to use the pivot points. Here is the price position in relation to pivot points:
| Pivot points | S3 | S2 | S1 | PP | R1 | R2 | R3 |
|---|---|---|---|---|---|---|---|
| Standard | 1.2534 | 1.2693 | 1.2795 | 1.2954 | 1.3056 | 1.3215 | 1.3317 |
| Camarilla | 1.2824 | 1.2848 | 1.2872 | 1.2896 | 1.2920 | 1.2944 | 1.2968 |
| Woodie | 1.2505 | 1.2679 | 1.2766 | 1.2940 | 1.3027 | 1.3201 | 1.3288 |
| Fibonacci | 1.2693 | 1.2793 | 1.2855 | 1.2954 | 1.3054 | 1.3116 | 1.3215 |
| Pivot points | S3 | S2 | S1 | PP | R1 | R2 | R3 |
|---|---|---|---|---|---|---|---|
| Standard | 1.2408 | 1.2631 | 1.2763 | 1.2986 | 1.3118 | 1.3341 | 1.3473 |
| Camarilla | 1.2798 | 1.2831 | 1.2864 | 1.2896 | 1.2929 | 1.2961 | 1.2994 |
| Woodie | 1.2364 | 1.2608 | 1.2719 | 1.2963 | 1.3074 | 1.3318 | 1.3429 |
| Fibonacci | 1.2631 | 1.2766 | 1.2850 | 1.2986 | 1.3121 | 1.3205 | 1.3341 |
| Pivot points | S3 | S2 | S1 | PP | R1 | R2 | R3 |
|---|---|---|---|---|---|---|---|
| Standard | 1.2214 | 1.2394 | 1.2656 | 1.2836 | 1.3098 | 1.3278 | 1.3540 |
| Camarilla | 1.2798 | 1.2838 | 1.2879 | 1.2919 | 1.2960 | 1.3000 | 1.3041 |
| Woodie | 1.2256 | 1.2415 | 1.2698 | 1.2857 | 1.3140 | 1.3299 | 1.3582 |
| Fibonacci | 1.2394 | 1.2563 | 1.2667 | 1.2836 | 1.3005 | 1.3109 | 1.3278 |
Numerical data
The following are the details of the technical indicators and moving averages that were collected to generate this technical analysis:
| RSI (14): | 45.13 | |
| MACD (12,26,9): | 0.0049 | |
| Directional Movement: | 3.1709 | |
| AROON (14): | -14.2857 | |
| DEMA (21): | 1.2990 | |
| Parabolic SAR (0,02-0,02-0,2): | 1.3208 | |
| Elder Ray (13): | -0.0061 | |
| Super Trend (3,10): | 1.3207 | |
| Zig ZAG (10): | 1.2824 | |
| VORTEX (21): | 0.9636 | |
| Stochastique (14,3,5): | 26.21 | |
| TEMA (21): | 1.2964 | |
| Williams %R (14): | -95.05 | |
| Chande Momentum Oscillator (20): | -0.0141 | |
| Repulse (5,40,3): | -1.5015 | |
| ROCnROLL: | -1 | |
| TRIX (15,9): | 0.0849 | |
| Courbe Coppock: | 0.26 |
| MA7: | 1.2940 | |
| MA20: | 1.2949 | |
| MA50: | 1.2734 | |
| MA100: | 1.2631 | |
| MAexp7: | 1.2927 | |
| MAexp20: | 1.2909 | |
| MAexp50: | 1.2793 | |
| MAexp100: | 1.2740 | |
| Price / MA7: | -1.37% | |
| Price / MA20: | -1.44% | |
| Price / MA50: | +0.23% | |
| Price / MA100: | +1.05% | |
| Price / MAexp7: | -1.27% | |
| Price / MAexp20: | -1.13% | |
| Price / MAexp50: | -0.23% | |
| Price / MAexp100: | +0.18% |
News
Don't forget to follow the news on GBP/USD. At the time of publication of this analysis, the latest news was as follows:
-
 Technical Outlook on USDJPY, NZDUSD, GBPUSD
-
GBP/USD Analysis: Can the Pound Hold the Floor?
-
GBP/USD Analysis: Will the Pound Continue Higher from Here?
-
GBP/USD Analysis: Can the Pound Hold Here?
-
GBP/USD Analysis: Can the Pound Stay in a Range?
About author

Online


Add a comment
Comments
0 comments on the analysis GBP/USD - Daily