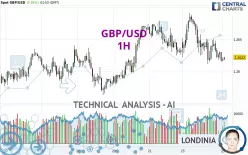
GBP/USD - 1H - Technical analysis published on 02/25/2025 (GMT)
- 114
- 0
Click here for a new analysis!
- Timeframe : 1H
- - Analysis generated on
- Status : INVALID

Summary of the analysis

Additional analysis
Quotes
The GBP/USD rating is 1.2622 USD. The price registered an increase of +0.04% on the session with the lowest point at 1.2616 USD and the highest point at 1.2623 USD. The deviation from the price is +0.05% for the low point and -0.01% for the high point.So that you have an overall view of the price change, here is a table showing the variations over several periods:
Near a new LOW record (1 year)
Type : Bearish
Timeframe : Weekly
Near a new LOW record (1st january)
Type : Bearish
Timeframe : Weekly
Near a new LOW record (1 month)
Type : Bearish
Timeframe : Weekly
Technical
A technical analysis in 1H of this GBP/USD chart shows a bearish trend. The signals given by moving averages are 78.57% bearish. This bearish trend is reinforced by the strong signals currently being given by short-term moving averages. An assessment of moving averages reveals a bearish signal that could impact this trend:
Moving Average bearish crossovers : AMA20 & AMA50
Type : Bearish
Timeframe : 1 hour
In fact, 11 technical indicators on 18 studied are currently positioned bearish. Caution: the Central Indicators scanner currently detects an excess:
CCI indicator is oversold : under -100
Type : Neutral
Timeframe : 1 hour
Price is back under the pivot point
Type : Bearish
Timeframe : Weekly
An analysis of the price chart with the Central Patterns scanner (detector of chart patterns and resistances and supports) shows several results that can have an impact on the price change:
Near horizontal support
Type : Bullish
Timeframe : 1 hour
Support of channel is broken
Type : Bearish
Timeframe : 1 hour
The Central Candlesticks scanner which studies Japanese candlesticks did not detect anything.
| S3 | S2 | S1 | Price | R1 | R2 | R3 | |
|---|---|---|---|---|---|---|---|
| ProTrendLines | 1.2518 | 1.2563 | 1.2612 | 1.2622 | 1.2635 | 1.2686 | 1.2824 |
| Change (%) | -0.82% | -0.47% | -0.08% | - | +0.10% | +0.51% | +1.60% |
| Change | -0.0104 | -0.0059 | -0.0010 | - | +0.0013 | +0.0064 | +0.0202 |
| Level | Minor | Intermediate | Major | - | Intermediate | Major | Intermediate |
To determine price objectives, it is also possible to use the pivot points. Here is the price position in relation to pivot points:
| Pivot points | S3 | S2 | S1 | PP | R1 | R2 | R3 |
|---|---|---|---|---|---|---|---|
| Standard | 1.2510 | 1.2561 | 1.2589 | 1.2640 | 1.2668 | 1.2719 | 1.2747 |
| Camarilla | 1.2595 | 1.2603 | 1.2610 | 1.2617 | 1.2624 | 1.2632 | 1.2639 |
| Woodie | 1.2499 | 1.2555 | 1.2578 | 1.2634 | 1.2657 | 1.2713 | 1.2736 |
| Fibonacci | 1.2561 | 1.2591 | 1.2610 | 1.2640 | 1.2670 | 1.2689 | 1.2719 |
| Pivot points | S3 | S2 | S1 | PP | R1 | R2 | R3 |
|---|---|---|---|---|---|---|---|
| Standard | 1.2455 | 1.2509 | 1.2571 | 1.2625 | 1.2687 | 1.2741 | 1.2803 |
| Camarilla | 1.2601 | 1.2612 | 1.2622 | 1.2633 | 1.2644 | 1.2654 | 1.2665 |
| Woodie | 1.2459 | 1.2511 | 1.2575 | 1.2627 | 1.2691 | 1.2743 | 1.2807 |
| Fibonacci | 1.2509 | 1.2553 | 1.2581 | 1.2625 | 1.2669 | 1.2697 | 1.2741 |
| Pivot points | S3 | S2 | S1 | PP | R1 | R2 | R3 |
|---|---|---|---|---|---|---|---|
| Standard | 1.1662 | 1.1881 | 1.2138 | 1.2357 | 1.2614 | 1.2833 | 1.3090 |
| Camarilla | 1.2264 | 1.2308 | 1.2351 | 1.2395 | 1.2439 | 1.2482 | 1.2526 |
| Woodie | 1.1681 | 1.1891 | 1.2157 | 1.2367 | 1.2633 | 1.2843 | 1.3109 |
| Fibonacci | 1.1881 | 1.2063 | 1.2175 | 1.2357 | 1.2539 | 1.2651 | 1.2833 |
Numerical data
The following are the details of the technical indicators and moving averages that were collected to generate this technical analysis:
| RSI (14): | 41.49 | |
| MACD (12,26,9): | -0.0008 | |
| Directional Movement: | -7.7076 | |
| AROON (14): | -7.1429 | |
| DEMA (21): | 1.2624 | |
| Parabolic SAR (0,02-0,02-0,2): | 1.2638 | |
| Elder Ray (13): | -0.0009 | |
| Super Trend (3,10): | 1.2664 | |
| Zig ZAG (10): | 1.2621 | |
| VORTEX (21): | 0.8466 | |
| Stochastique (14,3,5): | 17.95 | |
| TEMA (21): | 1.2618 | |
| Williams %R (14): | -76.92 | |
| Chande Momentum Oscillator (20): | -0.0024 | |
| Repulse (5,40,3): | -0.0330 | |
| ROCnROLL: | 2 | |
| TRIX (15,9): | -0.0069 | |
| Courbe Coppock: | 0.32 |
| MA7: | 1.2624 | |
| MA20: | 1.2514 | |
| MA50: | 1.2460 | |
| MA100: | 1.2650 | |
| MAexp7: | 1.2624 | |
| MAexp20: | 1.2633 | |
| MAexp50: | 1.2638 | |
| MAexp100: | 1.2626 | |
| Price / MA7: | -0.02% | |
| Price / MA20: | +0.86% | |
| Price / MA50: | +1.30% | |
| Price / MA100: | -0.22% | |
| Price / MAexp7: | -0.02% | |
| Price / MAexp20: | -0.09% | |
| Price / MAexp50: | -0.13% | |
| Price / MAexp100: | -0.03% |
News
The last news published on GBP/USD at the time of the generation of this analysis was as follows:
-
 GBP/USD Analysis: Can the Pound Continue Higher from Here?
-
GBP/USD Analysis: Can the USD Continue to Strengthen?
-
GBP/USD Analysis: Can the Pound Continue Higher?
-
Technical Outlook on USDCAD, USDJPY, GBPUSD
-
GBP/USD Analysis: Can the Pound Continue to Rise?
About author

Online


Add a comment
Comments
0 comments on the analysis GBP/USD - 1H