GBP/USD - 1H - Technical analysis published on 02/24/2025 (GMT)
- 61
- 0
- Timeframe : 1H
- - Analysis generated on
- Status : NEUTRAL

Summary of the analysis

Additional analysis
Quotes
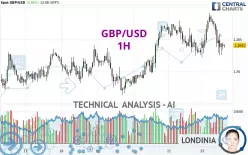
The GBP/USD rating is 1.2641 USD. On the day, this instrument gained +0.06% with the lowest point at 1.2622 USD and the highest point at 1.2691 USD. The deviation from the price is +0.15% for the low point and -0.39% for the high point.The Central Gaps scanner detects a bullish opening. A small advantage for buyers in the very short term.
Bullish opening
Type : Bullish
Timeframe : Openning
Here is a more detailed summary of the historical variations registered by GBP/USD:
Near a new LOW record (1 year)
Type : Bearish
Timeframe : Weekly
New HIGH record (1st january)
Type : Bullish
Timeframe : Weekly
New HIGH record (1 month)
Type : Bullish
Timeframe : Weekly
Technical
Technical analysis of this 1H chart of GBP/USD indicates that the overall trend is slightly bullish. 53.57% of the signals given by moving averages are bullish. Caution: the slightly bearish signals currently given by short-term moving averages indicate that this slightly bullish trend could be reversed. The Central Indicators market scanner currently does not detect any result that concerns moving averages.
An assessment of technical indicators shows a bearish signal.
Central Indicators, the scanner specialised in technical indicators, has identified these signals:
Aroon indicator bearish trend
Type : Bearish
Timeframe : 1 hour
MACD indicator is back under 0
Type : Bearish
Timeframe : 1 hour
The Central Patterns scanner, which studies chart patterns, resistances and supports, has identified this signal:
Near support of triangle
Type : Bullish
Timeframe : 1 hour
The Central Candlesticks scanner which studies Japanese candlesticks did not detect anything.
| S3 | S2 | S1 | Price | R1 | R2 | R3 | |
|---|---|---|---|---|---|---|---|
| ProTrendLines | 1.2498 | 1.2563 | 1.2640 | 1.2641 | 1.2686 | 1.2824 | 1.3128 |
| Change (%) | -1.13% | -0.62% | -0.01% | - | +0.36% | +1.45% | +3.85% |
| Change | -0.0143 | -0.0078 | -0.0001 | - | +0.0045 | +0.0183 | +0.0487 |
| Level | Major | Intermediate | Minor | - | Major | Intermediate | Major |
Attention could also be paid to pivot points to set price objectives:
| Pivot points | S3 | S2 | S1 | PP | R1 | R2 | R3 |
|---|---|---|---|---|---|---|---|
| Standard | 1.2558 | 1.2592 | 1.2612 | 1.2646 | 1.2666 | 1.2700 | 1.2720 |
| Camarilla | 1.2618 | 1.2623 | 1.2628 | 1.2633 | 1.2638 | 1.2643 | 1.2648 |
| Woodie | 1.2552 | 1.2589 | 1.2606 | 1.2643 | 1.2660 | 1.2697 | 1.2714 |
| Fibonacci | 1.2592 | 1.2612 | 1.2625 | 1.2646 | 1.2666 | 1.2679 | 1.2700 |
| Pivot points | S3 | S2 | S1 | PP | R1 | R2 | R3 |
|---|---|---|---|---|---|---|---|
| Standard | 1.2455 | 1.2509 | 1.2571 | 1.2625 | 1.2687 | 1.2741 | 1.2803 |
| Camarilla | 1.2601 | 1.2612 | 1.2622 | 1.2633 | 1.2644 | 1.2654 | 1.2665 |
| Woodie | 1.2459 | 1.2511 | 1.2575 | 1.2627 | 1.2691 | 1.2743 | 1.2807 |
| Fibonacci | 1.2509 | 1.2553 | 1.2581 | 1.2625 | 1.2669 | 1.2697 | 1.2741 |
| Pivot points | S3 | S2 | S1 | PP | R1 | R2 | R3 |
|---|---|---|---|---|---|---|---|
| Standard | 1.1662 | 1.1881 | 1.2138 | 1.2357 | 1.2614 | 1.2833 | 1.3090 |
| Camarilla | 1.2264 | 1.2308 | 1.2351 | 1.2395 | 1.2439 | 1.2482 | 1.2526 |
| Woodie | 1.1681 | 1.1891 | 1.2157 | 1.2367 | 1.2633 | 1.2843 | 1.3109 |
| Fibonacci | 1.1881 | 1.2063 | 1.2175 | 1.2357 | 1.2539 | 1.2651 | 1.2833 |
Numerical data
The following is the status of the technical indicators and moving averages at the time of publication of this technical analysis:
| RSI (14): | 43.24 | |
| MACD (12,26,9): | -0.0001 | |
| Directional Movement: | -2.8162 | |
| AROON (14): | -50.0000 | |
| DEMA (21): | 1.2651 | |
| Parabolic SAR (0,02-0,02-0,2): | 1.2677 | |
| Elder Ray (13): | -0.0011 | |
| Super Trend (3,10): | 1.2631 | |
| Zig ZAG (10): | 1.2639 | |
| VORTEX (21): | 1.0027 | |
| Stochastique (14,3,5): | 24.29 | |
| TEMA (21): | 1.2646 | |
| Williams %R (14): | -80.30 | |
| Chande Momentum Oscillator (20): | -0.0027 | |
| Repulse (5,40,3): | -0.0210 | |
| ROCnROLL: | 2 | |
| TRIX (15,9): | 0.0028 | |
| Courbe Coppock: | 0.05 |
| MA7: | 1.2622 | |
| MA20: | 1.2506 | |
| MA50: | 1.2461 | |
| MA100: | 1.2655 | |
| MAexp7: | 1.2646 | |
| MAexp20: | 1.2651 | |
| MAexp50: | 1.2645 | |
| MAexp100: | 1.2625 | |
| Price / MA7: | +0.15% | |
| Price / MA20: | +1.08% | |
| Price / MA50: | +1.44% | |
| Price / MA100: | -0.11% | |
| Price / MAexp7: | -0.04% | |
| Price / MAexp20: | -0.08% | |
| Price / MAexp50: | -0.03% | |
| Price / MAexp100: | +0.13% |
News
Don't forget to follow the news on GBP/USD. At the time of publication of this analysis, the latest news was as follows:
-
 GBP/USD Analysis: Can the Pound Continue Higher from Here?
-
GBP/USD Analysis: Can the USD Continue to Strengthen?
-
GBP/USD Analysis: Can the Pound Continue Higher?
-
Technical Outlook on USDCAD, USDJPY, GBPUSD
-
GBP/USD Analysis: Can the Pound Continue to Rise?
About author

Online


Add a comment
Comments
0 comments on the analysis GBP/USD - 1H