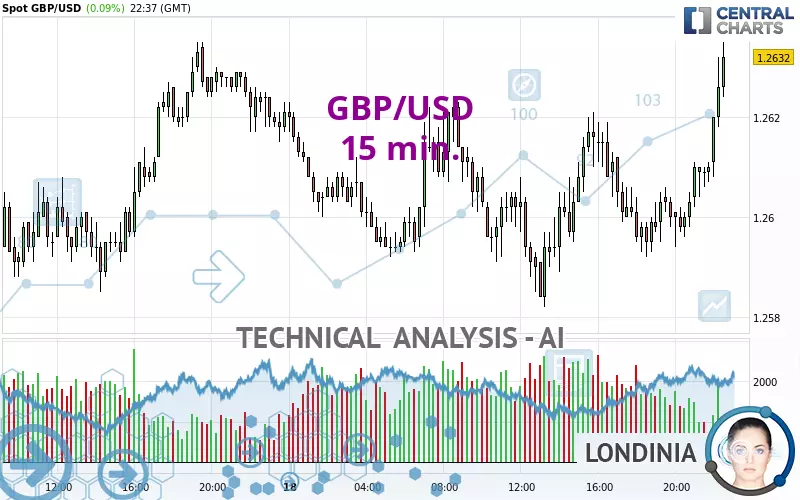
GBP/USD - 15 min. - Technical analysis published on 02/18/2025 (GMT)
- 155
- 0
Click here for a new analysis!
- Timeframe : 15 min.
- - Analysis generated on
- Status : INVALID

Summary of the analysis

Additional analysis
Quotes
GBP/USD rating 1.2633 USD. The price registered an increase of +0.10% on the session and was between 1.2582 USD and 1.2635 USD. This implies that the price is at +0.41% from its lowest and at -0.02% from its highest.The Central Gaps scanner detects a bearish opening marking the presence of sellers ahead of buyers at the opening but not sufficiently marked to allow the price to register a quotation gap.
Bearish opening
Type : Bearish
Timeframe : Openning
A study of price movements over other periods shows the following variations:
Near a new LOW record (1 year)
Type : Bearish
Timeframe : Weekly
Near a new LOW record (1st january)
Type : Bearish
Timeframe : Weekly
Near a new LOW record (1 month)
Type : Bearish
Timeframe : Weekly
Technical
Technical analysis of this 15 min. chart of GBP/USD indicates that the overall trend is bullish. The signals given by moving averages are 64.29% bullish. This bullish trend is slowing down slightly given the slightly bullish signals of short-term moving averages. The Central Indicators market scanner is currently detecting several bullish signals that could impact this trend:
Bullish trend reversal : Moving Average 50
Type : Bullish
Timeframe : 15 minutes
Moving Average bullish crossovers : AMA20 & AMA50
Type : Bullish
Timeframe : 15 minutes
Technical indicators are strongly bullish, suggesting that the price increase should continue.
Caution: the Central Indicators scanner currently detects an excess:
CCI indicator is overbought : over 100
Type : Neutral
Timeframe : 15 minutes
Previous candle closed over Bollinger bands
Type : Neutral
Timeframe : 15 minutes
Williams %R indicator is overbought : over -20
Type : Neutral
Timeframe : 15 minutes
The Central Patterns scanner, which studies chart patterns, resistances and supports, has identified these signals:
Near horizontal resistance
Type : Bearish
Timeframe : 15 minutes
Near resistance of triangle
Type : Bearish
Timeframe : 15 minutes
Resistance of channel is broken
Type : Bullish
Timeframe : 15 minutes
There is also a Japanese candlestick pattern detected by Central Candlesticks that could mark the end of the current short-term trend:
Doji
Type : Neutral
Timeframe : 15 minutes
| S3 | S2 | S1 | Price | R1 | R2 | R3 | |
|---|---|---|---|---|---|---|---|
| ProTrendLines | 1.2498 | 1.2577 | 1.2630 | 1.2633 | 1.2686 | 1.2824 | 1.3128 |
| Change (%) | -1.07% | -0.44% | -0.02% | - | +0.42% | +1.51% | +3.92% |
| Change | -0.0135 | -0.0056 | -0.0003 | - | +0.0053 | +0.0191 | +0.0495 |
| Level | Major | Intermediate | Intermediate | - | Major | Intermediate | Major |
Attention could also be paid to pivot points to set price objectives:
| Pivot points | S3 | S2 | S1 | PP | R1 | R2 | R3 |
|---|---|---|---|---|---|---|---|
| Standard | 1.2529 | 1.2553 | 1.2587 | 1.2611 | 1.2645 | 1.2669 | 1.2703 |
| Camarilla | 1.2605 | 1.2610 | 1.2616 | 1.2621 | 1.2626 | 1.2632 | 1.2637 |
| Woodie | 1.2534 | 1.2556 | 1.2592 | 1.2614 | 1.2650 | 1.2672 | 1.2708 |
| Fibonacci | 1.2553 | 1.2575 | 1.2589 | 1.2611 | 1.2633 | 1.2647 | 1.2669 |
| Pivot points | S3 | S2 | S1 | PP | R1 | R2 | R3 |
|---|---|---|---|---|---|---|---|
| Standard | 1.2104 | 1.2218 | 1.2402 | 1.2516 | 1.2700 | 1.2814 | 1.2998 |
| Camarilla | 1.2504 | 1.2531 | 1.2559 | 1.2586 | 1.2613 | 1.2641 | 1.2668 |
| Woodie | 1.2139 | 1.2236 | 1.2437 | 1.2534 | 1.2735 | 1.2832 | 1.3033 |
| Fibonacci | 1.2218 | 1.2332 | 1.2402 | 1.2516 | 1.2630 | 1.2700 | 1.2814 |
| Pivot points | S3 | S2 | S1 | PP | R1 | R2 | R3 |
|---|---|---|---|---|---|---|---|
| Standard | 1.1662 | 1.1881 | 1.2138 | 1.2357 | 1.2614 | 1.2833 | 1.3090 |
| Camarilla | 1.2264 | 1.2308 | 1.2351 | 1.2395 | 1.2439 | 1.2482 | 1.2526 |
| Woodie | 1.1681 | 1.1891 | 1.2157 | 1.2367 | 1.2633 | 1.2843 | 1.3109 |
| Fibonacci | 1.1881 | 1.2063 | 1.2175 | 1.2357 | 1.2539 | 1.2651 | 1.2833 |
Numerical data
The following is the status of the technical indicators and moving averages at the time of publication of this technical analysis:
| RSI (14): | 63.33 | |
| MACD (12,26,9): | 0.0002 | |
| Directional Movement: | 10.2220 | |
| AROON (14): | 100.0000 | |
| DEMA (21): | 1.2609 | |
| Parabolic SAR (0,02-0,02-0,2): | 1.2596 | |
| Elder Ray (13): | 0.0018 | |
| Super Trend (3,10): | 1.2605 | |
| Zig ZAG (10): | 1.2629 | |
| VORTEX (21): | 1.1447 | |
| Stochastique (14,3,5): | 92.57 | |
| TEMA (21): | 1.2617 | |
| Williams %R (14): | -5.26 | |
| Chande Momentum Oscillator (20): | 0.0025 | |
| Repulse (5,40,3): | 0.1065 | |
| ROCnROLL: | 1 | |
| TRIX (15,9): | 0.0012 | |
| Courbe Coppock: | 0.24 |
| MA7: | 1.2523 | |
| MA20: | 1.2460 | |
| MA50: | 1.2469 | |
| MA100: | 1.2680 | |
| MAexp7: | 1.2621 | |
| MAexp20: | 1.2606 | |
| MAexp50: | 1.2604 | |
| MAexp100: | 1.2604 | |
| Price / MA7: | +0.88% | |
| Price / MA20: | +1.39% | |
| Price / MA50: | +1.32% | |
| Price / MA100: | -0.37% | |
| Price / MAexp7: | +0.10% | |
| Price / MAexp20: | +0.21% | |
| Price / MAexp50: | +0.23% | |
| Price / MAexp100: | +0.23% |
News
The latest news and videos published on GBP/USD at the time of the analysis were as follows:
-
 GBP/USD Analysis: Can the Pound Continue Higher?
-
Technical Outlook on USDCAD, USDJPY, GBPUSD
-
GBP/USD Analysis: Can the Pound Continue to Rise?
-
GBP/USD Analysis: The Pound Recovers on Monday
-
GBP/USD Price Forecast Pound Shoots Higher After PMI
About author

Online


Add a comment
Comments
0 comments on the analysis GBP/USD - 15 min.