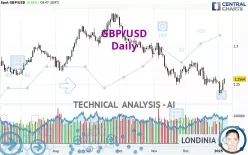
GBP/USD - Daily - Technical analysis published on 01/07/2025 (GMT)
- 218
- 0
- Who voted?
Click here for a new analysis!
- Timeframe : Daily
- - Analysis generated on
- Status : TARGET REACHED

Summary of the analysis

Additional analysis
Quotes
The GBP/USD price is 1.2564 USD. The price registered an increase of +0.44% on the session and was traded between 1.2504 USD and 1.2576 USD over the period. The price is currently at +0.48% from its lowest and -0.10% from its highest.A bullish opening was detected by the Central Gaps scanner. Buyers are trying to impose a bullish momentum in the very short term.
Bullish opening
Type : Bullish
Timeframe : Openning
So that you have an overall view of the price change, here is a table showing the variations over several periods:
Near a new LOW record (1 year)
Type : Bearish
Timeframe : Weekly
New HIGH record (1st january)
Type : Bullish
Timeframe : Weekly
Near a new HIGH record (1 month)
Type : Bullish
Timeframe : Weekly
Technical
Technical analysis of GBP/USD in Daily shows a overall strongly bearish trend. The signals given by moving averages are 92.86% bearish. This strong bearish trend is confirmed by the strong signals currently being given by short-term moving averages. The Central Indicators market scanner currently does not detect any result that concerns moving averages.
In fact, Central Analyzer took into account 18 technical indicators and the result was as follows: 6 are bullish, 7 are neutral and 5 are bearish. Other results related to technical indicators were also found by the Central Indicators scanner:
MACD crosses UP its Moving Average
Type : Bullish
Timeframe : Daily
Parabolic SAR indicator bullish reversal
Type : Bullish
Timeframe : Daily
Price is back over the pivot point
Type : Bullish
Timeframe : Weekly
Momentum indicator is back over 0
Type : Bullish
Timeframe : Daily
Williams %R indicator is back over -50
Type : Bullish
Timeframe : Daily
The Central Patterns scanner, which studies chart patterns, resistances and supports, has identified this signal:
Near resistance of channel
Type : Bearish
Timeframe : Daily
No result was found by the Central Candlesticks scanner on Japanese candlesticks.
| S3 | S2 | S1 | Price | R1 | R2 | R3 | |
|---|---|---|---|---|---|---|---|
| ProTrendLines | 1.2044 | 1.2343 | 1.2496 | 1.2564 | 1.2686 | 1.2824 | 1.3040 |
| Change (%) | -4.14% | -1.76% | -0.54% | - | +0.97% | +2.07% | +3.79% |
| Change | -0.0520 | -0.0221 | -0.0068 | - | +0.0122 | +0.0260 | +0.0476 |
| Level | Major | Major | Major | - | Intermediate | Intermediate | Intermediate |
To determine price objectives, it is also possible to use the pivot points. Here is the price position in relation to pivot points:
| Pivot points | S3 | S2 | S1 | PP | R1 | R2 | R3 |
|---|---|---|---|---|---|---|---|
| Standard | 1.2293 | 1.2353 | 1.2431 | 1.2491 | 1.2569 | 1.2629 | 1.2707 |
| Camarilla | 1.2471 | 1.2484 | 1.2496 | 1.2509 | 1.2522 | 1.2534 | 1.2547 |
| Woodie | 1.2302 | 1.2358 | 1.2440 | 1.2496 | 1.2578 | 1.2634 | 1.2716 |
| Fibonacci | 1.2353 | 1.2406 | 1.2438 | 1.2491 | 1.2544 | 1.2576 | 1.2629 |
| Pivot points | S3 | S2 | S1 | PP | R1 | R2 | R3 |
|---|---|---|---|---|---|---|---|
| Standard | 1.2061 | 1.2207 | 1.2315 | 1.2461 | 1.2569 | 1.2715 | 1.2823 |
| Camarilla | 1.2353 | 1.2376 | 1.2400 | 1.2423 | 1.2446 | 1.2470 | 1.2493 |
| Woodie | 1.2042 | 1.2198 | 1.2296 | 1.2452 | 1.2550 | 1.2706 | 1.2804 |
| Fibonacci | 1.2207 | 1.2304 | 1.2364 | 1.2461 | 1.2558 | 1.2618 | 1.2715 |
| Pivot points | S3 | S2 | S1 | PP | R1 | R2 | R3 |
|---|---|---|---|---|---|---|---|
| Standard | 1.2059 | 1.2267 | 1.2395 | 1.2603 | 1.2731 | 1.2939 | 1.3067 |
| Camarilla | 1.2431 | 1.2461 | 1.2492 | 1.2523 | 1.2554 | 1.2585 | 1.2615 |
| Woodie | 1.2019 | 1.2247 | 1.2355 | 1.2583 | 1.2691 | 1.2919 | 1.3027 |
| Fibonacci | 1.2267 | 1.2395 | 1.2475 | 1.2603 | 1.2731 | 1.2811 | 1.2939 |
Numerical data
The following are the details of the technical indicators and moving averages that were collected to generate this technical analysis:
| RSI (14): | 47.73 | |
| MACD (12,26,9): | -0.0063 | |
| Directional Movement: | -6.0140 | |
| AROON (14): | -71.4285 | |
| DEMA (21): | 1.2483 | |
| Parabolic SAR (0,02-0,02-0,2): | 1.2353 | |
| Elder Ray (13): | 0.0005 | |
| Super Trend (3,10): | 1.2696 | |
| Zig ZAG (10): | 1.2566 | |
| VORTEX (21): | 0.9070 | |
| Stochastique (14,3,5): | 38.92 | |
| TEMA (21): | 1.2480 | |
| Williams %R (14): | -43.88 | |
| Chande Momentum Oscillator (20): | -0.0003 | |
| Repulse (5,40,3): | 0.7084 | |
| ROCnROLL: | -1 | |
| TRIX (15,9): | -0.0699 | |
| Courbe Coppock: | 2.72 |
| MA7: | 1.2503 | |
| MA20: | 1.2587 | |
| MA50: | 1.2695 | |
| MA100: | 1.2919 | |
| MAexp7: | 1.2511 | |
| MAexp20: | 1.2567 | |
| MAexp50: | 1.2688 | |
| MAexp100: | 1.2781 | |
| Price / MA7: | +0.49% | |
| Price / MA20: | -0.18% | |
| Price / MA50: | -1.03% | |
| Price / MA100: | -2.75% | |
| Price / MAexp7: | +0.42% | |
| Price / MAexp20: | -0.02% | |
| Price / MAexp50: | -0.98% | |
| Price / MAexp100: | -1.70% |
News
Don't forget to follow the news on GBP/USD. At the time of publication of this analysis, the latest news was as follows:
-
 GBP/USD Price Forecast - Sterling Rises, for Now
-
GBP/USD Forecast - Will Support Hold??? (January 2, 2025)
-
GBP/USD Forecast - Pound Continues to Struggle Against the Dollar
-
GBP/USD Forecast December 24, 2024
-
GBP/USD Forecast - Cable Looks to Find a Bottom (December 23, 2024)
About author

Online


Add a comment
Comments
0 comments on the analysis GBP/USD - Daily