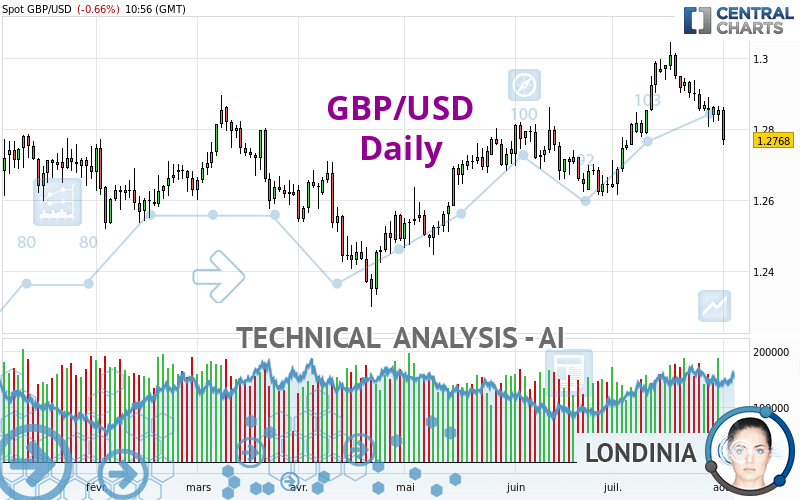
GBP/USD - Daily - Technical analysis published on 08/01/2024 (GMT)
- 116
- 0
- Timeframe : Daily
- - Analysis generated on
- Status : NEUTRAL

Summary of the analysis

Additional analysis
Quotes
The GBP/USD price is 1.2768 USD. The price is lower by -0.66% since the last closing and was traded between 1.2755 USD and 1.2861 USD over the period. The price is currently at +0.10% from its lowest and -0.72% from its highest.So that you have an overall view of the price change, here is a table showing the variations over several periods:
Near a new HIGH record (1 year)
Type : Bullish
Timeframe : Weekly
Near a new LOW record (1st january)
Type : Bearish
Timeframe : Weekly
Near a new HIGH record (1 month)
Type : Bullish
Timeframe : Weekly
Technical
Technical analysis of this Daily chart of GBP/USD indicates that the overall trend is slightly bullish. Only 60.71% of the signals given by moving averages are bullish. This slightly bullish trend could turn neutral or reverse given the slightly bearish signals currently being given by short-term moving averages. The Central Indicators scanner detects a bearish signal on moving averages that could impact this trend:
Bearish price crossover with Moving Average 50
Type : Bearish
Timeframe : Daily
In fact, according to the parameters integrated into the Central Analyzer system, 10 technical indicators out of 18 analysed are currently bearish. Caution: the Central Indicators scanner currently detects an excess:
CCI indicator is oversold : under -100
Type : Neutral
Timeframe : Daily
Williams %R indicator is oversold : under -80
Type : Neutral
Timeframe : Daily
Pivot points : price is under support 3
Type : Neutral
Timeframe : Daily
Pivot points : price is under support 3
Type : Neutral
Timeframe : Weekly
RSI indicator is back under 50
Type : Bearish
Timeframe : Daily
SuperTrend indicator bearish reversal
Type : Bearish
Timeframe : Daily
Central Patterns, the market scanner focusing on chart patterns, resistances and supports found this result:
Near support of channel
Type : Bullish
Timeframe : Daily
No result was found by the Central Candlesticks scanner on Japanese candlesticks.
| S3 | S2 | S1 | Price | R1 | R2 | R3 | |
|---|---|---|---|---|---|---|---|
| ProTrendLines | 1.2343 | 1.2536 | 1.2623 | 1.2768 | 1.2831 | 1.3008 | 1.3128 |
| Change (%) | -3.33% | -1.82% | -1.14% | - | +0.49% | +1.88% | +2.82% |
| Change | -0.0425 | -0.0232 | -0.0145 | - | +0.0063 | +0.0240 | +0.0360 |
| Level | Major | Minor | Intermediate | - | Major | Intermediate | Intermediate |
Attention could also be paid to pivot points to set price objectives:
| Pivot points | S3 | S2 | S1 | PP | R1 | R2 | R3 |
|---|---|---|---|---|---|---|---|
| Standard | 1.2785 | 1.2803 | 1.2828 | 1.2846 | 1.2871 | 1.2889 | 1.2914 |
| Camarilla | 1.2841 | 1.2845 | 1.2849 | 1.2853 | 1.2857 | 1.2861 | 1.2865 |
| Woodie | 1.2789 | 1.2805 | 1.2832 | 1.2848 | 1.2875 | 1.2891 | 1.2918 |
| Fibonacci | 1.2803 | 1.2819 | 1.2830 | 1.2846 | 1.2862 | 1.2873 | 1.2889 |
| Pivot points | S3 | S2 | S1 | PP | R1 | R2 | R3 |
|---|---|---|---|---|---|---|---|
| Standard | 1.2737 | 1.2793 | 1.2830 | 1.2886 | 1.2923 | 1.2979 | 1.3016 |
| Camarilla | 1.2841 | 1.2850 | 1.2859 | 1.2867 | 1.2876 | 1.2884 | 1.2893 |
| Woodie | 1.2728 | 1.2788 | 1.2821 | 1.2881 | 1.2914 | 1.2974 | 1.3007 |
| Fibonacci | 1.2793 | 1.2829 | 1.2851 | 1.2886 | 1.2922 | 1.2944 | 1.2979 |
| Pivot points | S3 | S2 | S1 | PP | R1 | R2 | R3 |
|---|---|---|---|---|---|---|---|
| Standard | 1.2202 | 1.2408 | 1.2631 | 1.2837 | 1.3060 | 1.3266 | 1.3489 |
| Camarilla | 1.2735 | 1.2774 | 1.2814 | 1.2853 | 1.2892 | 1.2932 | 1.2971 |
| Woodie | 1.2210 | 1.2412 | 1.2639 | 1.2841 | 1.3068 | 1.3270 | 1.3497 |
| Fibonacci | 1.2408 | 1.2572 | 1.2674 | 1.2837 | 1.3001 | 1.3103 | 1.3266 |
Numerical data
The following is the status of the technical indicators and moving averages at the time of publication of this technical analysis:
| RSI (14): | 42.24 | |
| MACD (12,26,9): | 0.0019 | |
| Directional Movement: | -7.1666 | |
| AROON (14): | -78.5714 | |
| DEMA (21): | 1.2888 | |
| Parabolic SAR (0,02-0,02-0,2): | 1.2967 | |
| Elder Ray (13): | -0.0051 | |
| Super Trend (3,10): | 1.2993 | |
| Zig ZAG (10): | 1.2775 | |
| VORTEX (21): | 1.0618 | |
| Stochastique (14,3,5): | 13.14 | |
| TEMA (21): | 1.2867 | |
| Williams %R (14): | -93.43 | |
| Chande Momentum Oscillator (20): | -0.0204 | |
| Repulse (5,40,3): | -0.7601 | |
| ROCnROLL: | 2 | |
| TRIX (15,9): | 0.0483 | |
| Courbe Coppock: | 0.66 |
| MA7: | 1.2849 | |
| MA20: | 1.2889 | |
| MA50: | 1.2787 | |
| MA100: | 1.2683 | |
| MAexp7: | 1.2844 | |
| MAexp20: | 1.2852 | |
| MAexp50: | 1.2791 | |
| MAexp100: | 1.2726 | |
| Price / MA7: | -0.63% | |
| Price / MA20: | -0.94% | |
| Price / MA50: | -0.15% | |
| Price / MA100: | +0.67% | |
| Price / MAexp7: | -0.59% | |
| Price / MAexp20: | -0.65% | |
| Price / MAexp50: | -0.18% | |
| Price / MAexp100: | +0.33% |
News
The last news published on GBP/USD at the time of the generation of this analysis was as follows:
-
 GBP/USD Forecast August 1, 2024
-
GBP/USD Forecast July 30, 2024
-
GBP/USD Forecast July 29, 2024
-
GBP/USD Forecast July 10, 2024
-
Weekly Technical Outlook: 08/07/2024 - USDJPY, GBPUSD, NZDUSD
About author

Online


Add a comment
Comments
0 comments on the analysis GBP/USD - Daily