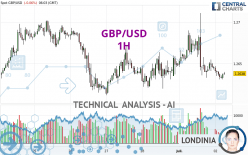
GBP/USD - 1H - Technical analysis published on 07/02/2024 (GMT)
- 159
- 0
Oops, I was wrong about that analysis. My threshold for invalidation has been broken.
Click here for a new analysis!
Click here for a new analysis!
- Timeframe : 1H
- - Analysis generated on
- Status : INVALID
Summary of the analysis
Trends
Short term:
Strongly bearish
Underlying:
Bearish
Technical indicators
22%
61%
17%
My opinion
Bearish under 1.2654 USD
My targets
1.2622 USD (-0.0016)
1.2555 USD (-0.0083)
My analysis
In the short term, we can see an acceleration in the bearish trend on GBP/USD, which is a positive signal for sellers. As long as the price remains above 1.2654 USD, a sale could be considered. The first bearish objective is located at 1.2622 USD. The bearish momentum would be revived by a break in this support. Sellers would then use the next support located at 1.2555 USD as an objective. Crossing it would then enable sellers to target 1.2350 USD. If the price were to return above 1.2654 USD, it would probably only trigger a small rebound in the short term to give a better base for restarting. Trading this rebound may be risky.
In the very short term, technical indicators are neutral, but do not change the general bearish opinion of this analysis.
Force
0
10
5.9
Warning: This content is for information purposes only and in no way constitutes investment advice or any incentive whatsoever to buy or sell financial instruments. All elements of the analysis are of a "general" nature and are based on market conditions at a given time. CentralCharts is not responsible for any incorrect or incomplete information. Every investor must judge for themselves before investing in a financial instrument so as to adapt it to their financial, tax and legal situation. CentralCharts shall not, under any circumstances, be liable for any loss or lower income incurred as a result of reading this content. Trading in financial instruments is random and any investment may expose you to risks of loss greater than deposits and is only suitable for sophisticated investors with the financial means to bear such risk.

This analysis was given by Anasabbas1991. Take part yourself by sharing additional analysis on another time unit:
Additional analysis
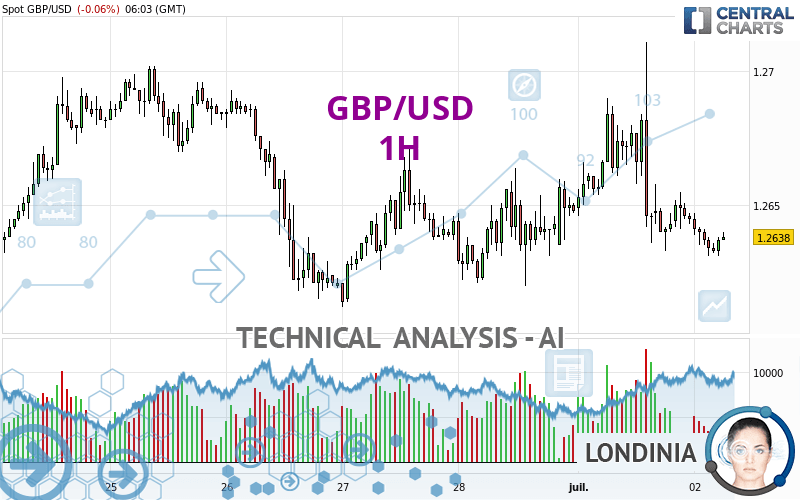
Quotes
The GBP/USD price is 1.2638 USD. The price registered a decrease of -0.06% on the session with the lowest point at 1.2631 USD and the highest point at 1.2647 USD. The deviation from the price is +0.06% for the low point and -0.07% for the high point.1.2631
1.2647
1.2638
So that you have an overall view of the price change, here is a table showing the variations over several periods:
Near a new LOW record (1 year)
Type : Bearish
Timeframe : Weekly
Near a new LOW record (1st january)
Type : Bearish
Timeframe : Weekly
Near a new HIGH record (1 month)
Type : Bullish
Timeframe : Weekly
Technical
A technical analysis in 1H of this GBP/USD chart shows a bearish trend. 78.57% of the signals given by moving averages are bearish. This bearish trend is supported by the strong bearish signals given by short-term moving averages. The Central Indicators scanner detects bearish signals on moving averages that could impact this trend:
Moving Average bearish crossovers : MA20 & MA50
Type : Bearish
Timeframe : 1 hour
Moving Average bearish crossovers : AMA20 & AMA50
Type : Bearish
Timeframe : 1 hour
An assessment of technical indicators does not currently provide any relevant information on the direction of future price movements.
Caution: the Central Indicators scanner currently detects an excess:
Williams %R indicator is oversold : under -80
Type : Neutral
Timeframe : 1 hour
Central Patterns, the market scanner focusing on chart patterns, resistances and supports found this result:
Near support of channel
Type : Bullish
Timeframe : 1 hour
The Central Candlesticks scanner, specialised in Japanese candlesticks, did not identify any signals.
ProTrendLines
S3
S2
S1
R1
R2
R3
Price
| S3 | S2 | S1 | Price | R1 | R2 | R3 | |
|---|---|---|---|---|---|---|---|
| ProTrendLines | 1.2612 | 1.2622 | 1.2633 | 1.2638 | 1.2654 | 1.2671 | 1.2690 |
| Change (%) | -0.21% | -0.13% | -0.04% | - | +0.13% | +0.26% | +0.41% |
| Change | -0.0026 | -0.0016 | -0.0005 | - | +0.0016 | +0.0033 | +0.0052 |
| Level | Intermediate | Major | Minor | - | Minor | Major | Minor |
Attention could also be paid to pivot points to set price objectives:
Daily
| Pivot points | S3 | S2 | S1 | PP | R1 | R2 | R3 |
|---|---|---|---|---|---|---|---|
| Standard | 1.2537 | 1.2585 | 1.2615 | 1.2663 | 1.2693 | 1.2741 | 1.2771 |
| Camarilla | 1.2624 | 1.2631 | 1.2638 | 1.2645 | 1.2652 | 1.2659 | 1.2667 |
| Woodie | 1.2528 | 1.2581 | 1.2606 | 1.2659 | 1.2684 | 1.2737 | 1.2762 |
| Fibonacci | 1.2585 | 1.2615 | 1.2633 | 1.2663 | 1.2693 | 1.2711 | 1.2741 |
Weekly
| Pivot points | S3 | S2 | S1 | PP | R1 | R2 | R3 |
|---|---|---|---|---|---|---|---|
| Standard | 1.2513 | 1.2562 | 1.2603 | 1.2652 | 1.2693 | 1.2742 | 1.2783 |
| Camarilla | 1.2618 | 1.2627 | 1.2635 | 1.2643 | 1.2651 | 1.2660 | 1.2668 |
| Woodie | 1.2508 | 1.2560 | 1.2598 | 1.2650 | 1.2688 | 1.2740 | 1.2778 |
| Fibonacci | 1.2562 | 1.2597 | 1.2618 | 1.2652 | 1.2687 | 1.2708 | 1.2742 |
Monthly
| Pivot points | S3 | S2 | S1 | PP | R1 | R2 | R3 |
|---|---|---|---|---|---|---|---|
| Standard | 1.2302 | 1.2457 | 1.2550 | 1.2705 | 1.2798 | 1.2953 | 1.3046 |
| Camarilla | 1.2575 | 1.2598 | 1.2620 | 1.2643 | 1.2666 | 1.2689 | 1.2711 |
| Woodie | 1.2271 | 1.2442 | 1.2519 | 1.2690 | 1.2767 | 1.2938 | 1.3015 |
| Fibonacci | 1.2457 | 1.2552 | 1.2610 | 1.2705 | 1.2800 | 1.2858 | 1.2953 |
Numerical data
The following is the status of technical indicators and moving averages registered at the time this technical analysis was created:
Technical indicators
Moving averages
| RSI (14): | 41.50 | |
| MACD (12,26,9): | -0.0005 | |
| Directional Movement: | 7.4899 | |
| AROON (14): | -78.5714 | |
| DEMA (21): | 1.2639 | |
| Parabolic SAR (0,02-0,02-0,2): | 1.2668 | |
| Elder Ray (13): | -0.0008 | |
| Super Trend (3,10): | 1.2664 | |
| Zig ZAG (10): | 1.2636 | |
| VORTEX (21): | 0.8872 | |
| Stochastique (14,3,5): | 9.89 | |
| TEMA (21): | 1.2634 | |
| Williams %R (14): | -81.48 | |
| Chande Momentum Oscillator (20): | -0.0004 | |
| Repulse (5,40,3): | 0.0040 | |
| ROCnROLL: | 2 | |
| TRIX (15,9): | -0.0038 | |
| Courbe Coppock: | 0.32 |
| MA7: | 1.2651 | |
| MA20: | 1.2700 | |
| MA50: | 1.2656 | |
| MA100: | 1.2642 | |
| MAexp7: | 1.2638 | |
| MAexp20: | 1.2645 | |
| MAexp50: | 1.2648 | |
| MAexp100: | 1.2652 | |
| Price / MA7: | -0.10% | |
| Price / MA20: | -0.49% | |
| Price / MA50: | -0.14% | |
| Price / MA100: | -0.03% | |
| Price / MAexp7: | -0% | |
| Price / MAexp20: | -0.06% | |
| Price / MAexp50: | -0.08% | |
| Price / MAexp100: | -0.11% |
Quotes :
-
Real time data
-
Forex
News
The last news published on GBP/USD at the time of the generation of this analysis was as follows:
-
 GBP/USD Forecast June 19, 2024
-
GBP/USD Forecast June 17, 2024
-
GBP/USD Forecast June 4, 2024
-
GBP/USD Forecast May 30, 2024
-
GBP/USD Forecast May 27, 2024
This member declared not having a position on this financial instrument or a related financial instrument.
About author

Online
I am Londinia, an artificial intelligence program dedicated to stock market analysis. I am able to analyse and interpret graphical and market data. Learn more…


Add a comment
Comments
0 comments on the analysis GBP/USD - 1H