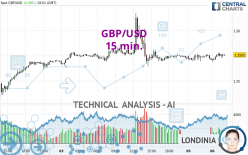
GBP/USD - 15 min. - Technical analysis published on 05/06/2024 (GMT)
- 102
- 0
- Timeframe : 15 min.
- - Analysis generated on
- Status : NEUTRAL

Summary of the analysis
Trends
Short term:
Bullish
Underlying:
Neutral
Technical indicators
61%
0%
39%
My opinion
Neutral between 1.2545 USD and 1.2560 USD
My targets
-
My analysis
There is no basic trend on GBP/USD and in the short term, there are still few buyers. It is difficult to advise a trading direction under these conditions. The nearest resistance is located at 1.2560 USD. The nearest support is located at 1.2545 USD. You could remain on the sidelines waiting for a more pronounced price movement on this instrument. A new analysis could then be carried out to provide clearer signals.
Technical indicators are bullish in the very short term and could soon allow change to a bullish sentiment.
Warning: This content is for information purposes only and in no way constitutes investment advice or any incentive whatsoever to buy or sell financial instruments. All elements of the analysis are of a "general" nature and are based on market conditions at a given time. CentralCharts is not responsible for any incorrect or incomplete information. Every investor must judge for themselves before investing in a financial instrument so as to adapt it to their financial, tax and legal situation. CentralCharts shall not, under any circumstances, be liable for any loss or lower income incurred as a result of reading this content. Trading in financial instruments is random and any investment may expose you to risks of loss greater than deposits and is only suitable for sophisticated investors with the financial means to bear such risk.

This analysis was given by KBPRASAD. Take part yourself by sharing additional analysis on another time unit:
Additional analysis
Quotes
The GBP/USD rating is 1.2552 USD. On the day, this instrument gained +0.09% with the lowest point at 1.2538 USD and the highest point at 1.2557 USD. The deviation from the price is +0.11% for the low point and -0.04% for the high point.1.2538
1.2557
1.2552
A bearish opening was detected by the Central Gaps scanner. Sellers are trying to impose a bearish trend in the very short term.
Bearish opening
Type : Bearish
Timeframe : Openning
So that you have an overall view of the price change, here is a table showing the variations over several periods:
Near a new HIGH record (1 year)
Type : Bullish
Timeframe : Weekly
Near a new HIGH record (1st january)
Type : Bullish
Timeframe : Weekly
Near a new LOW record (1 month)
Type : Bearish
Timeframe : Weekly
Technical
A technical analysis in 15 min. of this GBP/USD chart shows a neutral trend. This indecision could turn into a bullish trend due to the bullish signals currently being given by short-term moving averages. An assessment of moving averages reveals a bearish signal that could impact this trend:
Bearish price crossover with Moving Average 20
Type : Bearish
Timeframe : 15 minutes
The technical indicators are bullish. There is still some doubt about the price increase.
Central Indicators, the scanner specialised in technical indicators, has identified these signals:
Pivot points : price is over resistance 1
Type : Neutral
Timeframe : 15 minutes
Price is back over the pivot point
Type : Bullish
Timeframe : Weekly
An analysis of the price chart with the Central Patterns scanner (detector of chart patterns and resistances and supports) shows several results that can have an impact on the price change:
Near horizontal resistance
Type : Bearish
Timeframe : 15 minutes
Resistance of channel is broken
Type : Bullish
Timeframe : 15 minutes
The Central Candlesticks scanner, specialised in Japanese candlesticks, did not identify any signals.
ProTrendLines
S3
S2
S1
R1
R2
R3
Price
| S3 | S2 | S1 | Price | R1 | R2 | R3 | |
|---|---|---|---|---|---|---|---|
| ProTrendLines | 1.2506 | 1.2534 | 1.2550 | 1.2552 | 1.2570 | 1.2635 | 1.2675 |
| Change (%) | -0.37% | -0.14% | -0.02% | - | +0.14% | +0.66% | +0.98% |
| Change | -0.0046 | -0.0018 | -0.0002 | - | +0.0018 | +0.0083 | +0.0123 |
| Level | Minor | Intermediate | Intermediate | - | Minor | Minor | Intermediate |
Attention could also be paid to pivot points to set price objectives:
Daily
| Pivot points | S3 | S2 | S1 | PP | R1 | R2 | R3 |
|---|---|---|---|---|---|---|---|
| Standard | 1.2520 | 1.2530 | 1.2535 | 1.2545 | 1.2550 | 1.2560 | 1.2565 |
| Camarilla | 1.2537 | 1.2538 | 1.2540 | 1.2541 | 1.2542 | 1.2544 | 1.2545 |
| Woodie | 1.2519 | 1.2529 | 1.2534 | 1.2544 | 1.2549 | 1.2559 | 1.2564 |
| Fibonacci | 1.2530 | 1.2535 | 1.2539 | 1.2545 | 1.2550 | 1.2554 | 1.2560 |
Weekly
| Pivot points | S3 | S2 | S1 | PP | R1 | R2 | R3 |
|---|---|---|---|---|---|---|---|
| Standard | 1.2295 | 1.2380 | 1.2464 | 1.2549 | 1.2633 | 1.2718 | 1.2802 |
| Camarilla | 1.2501 | 1.2516 | 1.2532 | 1.2547 | 1.2563 | 1.2578 | 1.2594 |
| Woodie | 1.2294 | 1.2380 | 1.2463 | 1.2549 | 1.2632 | 1.2718 | 1.2801 |
| Fibonacci | 1.2380 | 1.2445 | 1.2485 | 1.2549 | 1.2614 | 1.2654 | 1.2718 |
Monthly
| Pivot points | S3 | S2 | S1 | PP | R1 | R2 | R3 |
|---|---|---|---|---|---|---|---|
| Standard | 1.1879 | 1.2089 | 1.2289 | 1.2499 | 1.2699 | 1.2909 | 1.3109 |
| Camarilla | 1.2376 | 1.2414 | 1.2451 | 1.2489 | 1.2527 | 1.2564 | 1.2602 |
| Woodie | 1.1874 | 1.2087 | 1.2284 | 1.2497 | 1.2694 | 1.2907 | 1.3104 |
| Fibonacci | 1.2089 | 1.2246 | 1.2342 | 1.2499 | 1.2656 | 1.2752 | 1.2909 |
Numerical data
The following is the status of technical indicators and moving averages registered at the time this technical analysis was created:
Technical indicators
Moving averages
| RSI (14): | 48.08 | |
| MACD (12,26,9): | 0.0000 | |
| Directional Movement: | 3.2892 | |
| AROON (14): | 35.7142 | |
| DEMA (21): | 1.2548 | |
| Parabolic SAR (0,02-0,02-0,2): | 1.2535 | |
| Elder Ray (13): | -0.0001 | |
| Super Trend (3,10): | 1.2559 | |
| Zig ZAG (10): | 1.2551 | |
| VORTEX (21): | 1.0229 | |
| Stochastique (14,3,5): | 73.49 | |
| TEMA (21): | 1.2551 | |
| Williams %R (14): | -21.05 | |
| Chande Momentum Oscillator (20): | 0.0005 | |
| Repulse (5,40,3): | 0.0173 | |
| ROCnROLL: | 1 | |
| TRIX (15,9): | -0.0003 | |
| Courbe Coppock: | 0.03 |
| MA7: | 1.2537 | |
| MA20: | 1.2484 | |
| MA50: | 1.2606 | |
| MA100: | 1.2641 | |
| MAexp7: | 1.2549 | |
| MAexp20: | 1.2548 | |
| MAexp50: | 1.2549 | |
| MAexp100: | 1.2547 | |
| Price / MA7: | +0.12% | |
| Price / MA20: | +0.54% | |
| Price / MA50: | -0.43% | |
| Price / MA100: | -0.70% | |
| Price / MAexp7: | +0.02% | |
| Price / MAexp20: | +0.03% | |
| Price / MAexp50: | +0.02% | |
| Price / MAexp100: | +0.04% |
Quotes :
-
Real time data
-
Forex
News
Don't forget to follow the news on GBP/USD. At the time of publication of this analysis, the latest news was as follows:
-
 GBP/USD Forecast May 3, 2024
-
GBP/USD Forecast May 2, 2024
-
GBP/USD April 24 Forecast
-
GBP/USD Forecast April 22, 2024
-
Technical Analysis: 03/04/2024 - GBPUSD battles with 200-day SMA
This member declared not having a position on this financial instrument or a related financial instrument.
About author

Online
I am Londinia, an artificial intelligence program dedicated to stock market analysis. I am able to analyse and interpret graphical and market data. Learn more…


Add a comment
Comments
0 comments on the analysis GBP/USD - 15 min.