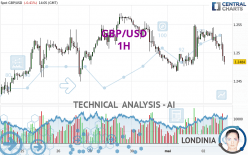
GBP/USD - 1H - Technical analysis published on 05/02/2024 (GMT)
- 72
- 0
Click here for a new analysis!
- Timeframe : 1H
- - Analysis generated on
- Status : INVALID

Summary of the analysis

Additional analysis
Quotes
The GBP/USD price is 1.2484 USD. The price registered a decrease of -0.42% on the session and was traded between 1.2479 USD and 1.2545 USD over the period. The price is currently at +0.04% from its lowest and -0.49% from its highest.Here is a more detailed summary of the historical variations registered by GBP/USD:
Near a new HIGH record (1 year)
Type : Bullish
Timeframe : Weekly
Near a new HIGH record (1st january)
Type : Bullish
Timeframe : Weekly
Near a new HIGH record (1 month)
Type : Bullish
Timeframe : Weekly
Technical
A technical analysis in 1H of this GBP/USD chart shows a bearish trend. The signals given by moving averages are at 71.43% bearish. This bearish trend shows slight signs of slowing down given the slightly bearish signals of short-term moving averages. The Central Indicators market scanner is currently detecting several bearish signals that could impact this trend:
Bearish trend reversal : adaptative moving average 50
Type : Bearish
Timeframe : 1 hour
Bearish trend reversal : adaptative moving average 100
Type : Bearish
Timeframe : 1 hour
Bearish price crossover with Moving Average 50
Type : Bearish
Timeframe : 1 hour
Bearish price crossover with adaptative moving average 20
Type : Bearish
Timeframe : 1 hour
Bearish price crossover with adaptative moving average 50
Type : Bearish
Timeframe : 1 hour
In fact, only 8 technical indicators out of 18 studied are currently positioned bearish. Caution: the Central Indicators scanner currently detects an excess:
CCI indicator is oversold : under -100
Type : Neutral
Timeframe : 1 hour
Williams %R indicator is oversold : under -80
Type : Neutral
Timeframe : 1 hour
Ichimoku : price is under the cloud
Type : Bearish
Timeframe : 1 hour
Central Patterns, the scanner specializing in chart patterns, did not identify any signals.
The Central Candlesticks scanner, specialised in Japanese candlesticks, did not identify any signals.
| S3 | S2 | S1 | Price | R1 | R2 | R3 | |
|---|---|---|---|---|---|---|---|
| ProTrendLines | 1.2350 | 1.2418 | 1.2466 | 1.2484 | 1.2534 | 1.2570 | 1.2675 |
| Change (%) | -1.07% | -0.53% | -0.14% | - | +0.40% | +0.69% | +1.53% |
| Change | -0.0134 | -0.0066 | -0.0018 | - | +0.0050 | +0.0086 | +0.0191 |
| Level | Major | Major | Major | - | Intermediate | Intermediate | Intermediate |
Pivot points can also be used to set your price objectives. Here is the price situation in relation to pivot points:
| Pivot points | S3 | S2 | S1 | PP | R1 | R2 | R3 |
|---|---|---|---|---|---|---|---|
| Standard | 1.2401 | 1.2433 | 1.2485 | 1.2517 | 1.2569 | 1.2601 | 1.2653 |
| Camarilla | 1.2513 | 1.2521 | 1.2528 | 1.2536 | 1.2544 | 1.2551 | 1.2559 |
| Woodie | 1.2410 | 1.2438 | 1.2494 | 1.2522 | 1.2578 | 1.2606 | 1.2662 |
| Fibonacci | 1.2433 | 1.2465 | 1.2485 | 1.2517 | 1.2549 | 1.2569 | 1.2601 |
| Pivot points | S3 | S2 | S1 | PP | R1 | R2 | R3 |
|---|---|---|---|---|---|---|---|
| Standard | 1.2106 | 1.2202 | 1.2348 | 1.2444 | 1.2590 | 1.2686 | 1.2832 |
| Camarilla | 1.2427 | 1.2449 | 1.2471 | 1.2493 | 1.2515 | 1.2537 | 1.2560 |
| Woodie | 1.2130 | 1.2215 | 1.2372 | 1.2457 | 1.2614 | 1.2699 | 1.2856 |
| Fibonacci | 1.2202 | 1.2295 | 1.2352 | 1.2444 | 1.2537 | 1.2594 | 1.2686 |
| Pivot points | S3 | S2 | S1 | PP | R1 | R2 | R3 |
|---|---|---|---|---|---|---|---|
| Standard | 1.1879 | 1.2089 | 1.2289 | 1.2499 | 1.2699 | 1.2909 | 1.3109 |
| Camarilla | 1.2376 | 1.2414 | 1.2451 | 1.2489 | 1.2527 | 1.2564 | 1.2602 |
| Woodie | 1.1874 | 1.2087 | 1.2284 | 1.2497 | 1.2694 | 1.2907 | 1.3104 |
| Fibonacci | 1.2089 | 1.2246 | 1.2342 | 1.2499 | 1.2656 | 1.2752 | 1.2909 |
Numerical data
The following are the details of the technical indicators and moving averages that were collected to generate this technical analysis:
| RSI (14): | 39.55 | |
| MACD (12,26,9): | 0.0001 | |
| Directional Movement: | -4.0049 | |
| AROON (14): | -42.8571 | |
| DEMA (21): | 1.2519 | |
| Parabolic SAR (0,02-0,02-0,2): | 1.2541 | |
| Elder Ray (13): | -0.0014 | |
| Super Trend (3,10): | 1.2487 | |
| Zig ZAG (10): | 1.2493 | |
| VORTEX (21): | 1.0177 | |
| Stochastique (14,3,5): | 20.06 | |
| TEMA (21): | 1.2517 | |
| Williams %R (14): | -88.14 | |
| Chande Momentum Oscillator (20): | -0.0038 | |
| Repulse (5,40,3): | -0.2542 | |
| ROCnROLL: | 2 | |
| TRIX (15,9): | 0.0067 | |
| Courbe Coppock: | 0.17 |
| MA7: | 1.2505 | |
| MA20: | 1.2499 | |
| MA50: | 1.2613 | |
| MA100: | 1.2645 | |
| MAexp7: | 1.2512 | |
| MAexp20: | 1.2515 | |
| MAexp50: | 1.2513 | |
| MAexp100: | 1.2507 | |
| Price / MA7: | -0.17% | |
| Price / MA20: | -0.12% | |
| Price / MA50: | -1.02% | |
| Price / MA100: | -1.27% | |
| Price / MAexp7: | -0.22% | |
| Price / MAexp20: | -0.25% | |
| Price / MAexp50: | -0.23% | |
| Price / MAexp100: | -0.18% |
News
Don't forget to follow the news on GBP/USD. At the time of publication of this analysis, the latest news was as follows:
-
 GBP/USD Forecast May 3, 2024
-
GBP/USD Forecast May 2, 2024
-
GBP/USD April 24 Forecast
-
GBP/USD Forecast April 22, 2024
-
Technical Analysis: 03/04/2024 - GBPUSD battles with 200-day SMA
About author

Online


Add a comment
Comments
0 comments on the analysis GBP/USD - 1H