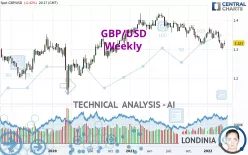
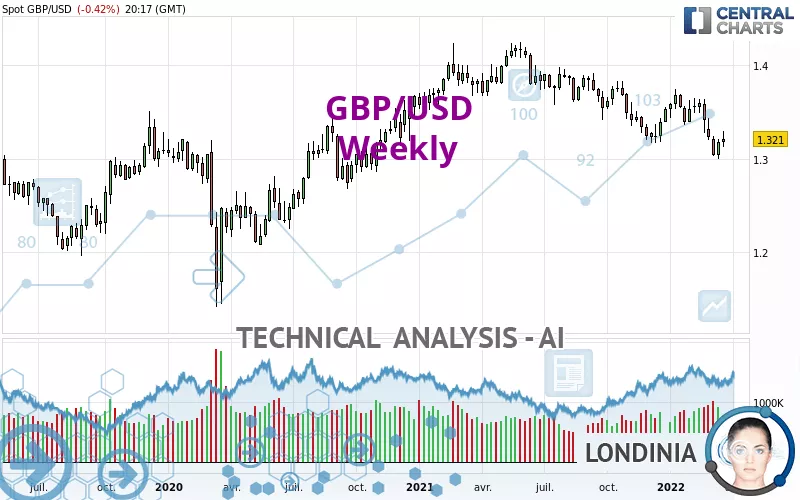
GBP/USD - Weekly - Technical analysis published on 03/23/2022 (GMT)
- 239
- 0
I am delighted to see that my first price objective has been achieved. I hope you've taken advantage of it.
Click here for a new analysis!
Click here for a new analysis!
- Timeframe : Weekly
- - Analysis generated on
- Status : TARGET REACHED
Summary of the analysis
Trends
Short term:
Strongly bearish
Underlying:
Bearish
Technical indicators
17%
72%
11%
My opinion
Bearish under 1.3620 USD
My targets
1.2977 USD (-0.0233)
1.2493 USD (-0.0717)
My analysis
In the short term, we can see an acceleration in the bearish trend on GBP/USD, which is a positive signal for sellers. As long as the price remains above 1.3620 USD, a sale could be considered. The first bearish objective is located at 1.2977 USD. The bearish momentum would be revived by a break in this support. Sellers would then use the next support located at 1.2493 USD as an objective. Crossing it would then enable sellers to target 1.2037 USD. If the price were to return above 1.3620 USD, it would probably only trigger a small rebound in the short term to give a better base for restarting. Trading this rebound may be risky.
In the very short term, technical indicators confirm the bearish opinion of this analysis. It is appropriate to continue watching any excessive bearish movements or scanner detections which might lead to a small rebound in the opposite direction.
Force
0
10
6.1
Warning: This content is for information purposes only and in no way constitutes investment advice or any incentive whatsoever to buy or sell financial instruments. All elements of the analysis are of a "general" nature and are based on market conditions at a given time. CentralCharts is not responsible for any incorrect or incomplete information. Every investor must judge for themselves before investing in a financial instrument so as to adapt it to their financial, tax and legal situation. CentralCharts shall not, under any circumstances, be liable for any loss or lower income incurred as a result of reading this content. Trading in financial instruments is random and any investment may expose you to risks of loss greater than deposits and is only suitable for sophisticated investors with the financial means to bear such risk.

This analysis was given by TheFuss. Take part yourself by sharing additional analysis on another time unit:
Additional analysis
Quotes
The GBP/USD rating is 1.3210 USD. The price is up +0.53% over 5 days and was traded between 1.3120 USD and 1.3274 USD over the period. The price is currently at +0.69% from its lowest point and -0.48% from its highest point.1.3120
1.3274
1.3210
A study of price movements over other periods shows the following variations:
Near a new LOW record (1 year)
Type : Bearish
Timeframe : Weekly
Near a new HIGH record (1st january)
Type : Bullish
Timeframe : Weekly
Near a new HIGH record (1 month)
Type : Bullish
Timeframe : Weekly
Technical
Technical analysis of this Weekly chart of GBP/USD indicates that the overall trend is bearish. 75.00% of the signals given by moving averages are bearish. The overall trend is reinforced by the strong bearish signals from short-term moving averages. The Central Indicators scanner does not detect any result on moving averages that would impact this trend.
An assessment of technical indicators shows a strong bearish signal.
The Central Indicators scanner specialised in technical indicators, has not detected anything further.
Central Patterns, the market scanner focusing on chart patterns, resistances and supports found this result:
Near support of channel
Type : Bullish
Timeframe : Weekly
The Central Candlesticks scanner which studies Japanese candlesticks did not detect anything.
ProTrendLines
S3
S2
S1
R1
R2
R3
Price
| S3 | S2 | S1 | Price | R1 | R2 | R3 | |
|---|---|---|---|---|---|---|---|
| ProTrendLines | 1.2037 | 1.2493 | 1.2977 | 1.3210 | 1.3317 | 1.3964 | 1.4263 |
| Change (%) | -8.88% | -5.43% | -1.76% | - | +0.81% | +5.71% | +7.97% |
| Change | -0.1173 | -0.0717 | -0.0233 | - | +0.0107 | +0.0754 | +0.1053 |
| Level | Major | Intermediate | Intermediate | - | Major | Intermediate | Major |
Attention could also be paid to pivot points to set price objectives:
Daily
| Pivot points | S3 | S2 | S1 | PP | R1 | R2 | R3 |
|---|---|---|---|---|---|---|---|
| Standard | 1.3012 | 1.3066 | 1.3166 | 1.3220 | 1.3320 | 1.3374 | 1.3474 |
| Camarilla | 1.3224 | 1.3238 | 1.3252 | 1.3266 | 1.3280 | 1.3294 | 1.3308 |
| Woodie | 1.3035 | 1.3078 | 1.3189 | 1.3232 | 1.3343 | 1.3386 | 1.3497 |
| Fibonacci | 1.3066 | 1.3125 | 1.3161 | 1.3220 | 1.3279 | 1.3315 | 1.3374 |
Weekly
| Pivot points | S3 | S2 | S1 | PP | R1 | R2 | R3 |
|---|---|---|---|---|---|---|---|
| Standard | 1.2835 | 1.2918 | 1.3046 | 1.3129 | 1.3257 | 1.3340 | 1.3468 |
| Camarilla | 1.3117 | 1.3136 | 1.3156 | 1.3175 | 1.3194 | 1.3214 | 1.3233 |
| Woodie | 1.2859 | 1.2929 | 1.3070 | 1.3140 | 1.3281 | 1.3351 | 1.3492 |
| Fibonacci | 1.2918 | 1.2998 | 1.3048 | 1.3129 | 1.3209 | 1.3259 | 1.3340 |
Monthly
| Pivot points | S3 | S2 | S1 | PP | R1 | R2 | R3 |
|---|---|---|---|---|---|---|---|
| Standard | 1.2878 | 1.3075 | 1.3249 | 1.3446 | 1.3620 | 1.3817 | 1.3991 |
| Camarilla | 1.3320 | 1.3354 | 1.3388 | 1.3422 | 1.3456 | 1.3490 | 1.3524 |
| Woodie | 1.2866 | 1.3069 | 1.3237 | 1.3440 | 1.3608 | 1.3811 | 1.3979 |
| Fibonacci | 1.3075 | 1.3217 | 1.3305 | 1.3446 | 1.3588 | 1.3676 | 1.3817 |
Numerical data
The following are the details of the technical indicators and moving averages that were collected to generate this technical analysis:
Technical indicators
Moving averages
| RSI (14): | 41.16 | |
| MACD (12,26,9): | -0.0108 | |
| Directional Movement: | -11.9932 | |
| AROON (14): | -64.2857 | |
| DEMA (21): | 1.3275 | |
| Parabolic SAR (0,02-0,02-0,2): | 1.3622 | |
| Elder Ray (13): | -0.0141 | |
| Super Trend (3,10): | 1.3731 | |
| Zig ZAG (10): | 1.3208 | |
| VORTEX (21): | 0.8714 | |
| Stochastique (14,3,5): | 17.55 | |
| TEMA (21): | 1.3216 | |
| Williams %R (14): | -72.23 | |
| Chande Momentum Oscillator (20): | -0.0320 | |
| Repulse (5,40,3): | -0.3759 | |
| ROCnROLL: | 2 | |
| TRIX (15,9): | -0.0920 | |
| Courbe Coppock: | 1.36 |
| MA7: | 1.3166 | |
| MA20: | 1.3211 | |
| MA50: | 1.3417 | |
| MA100: | 1.3407 | |
| MAexp7: | 1.3274 | |
| MAexp20: | 1.3410 | |
| MAexp50: | 1.3504 | |
| MAexp100: | 1.3425 | |
| Price / MA7: | +0.33% | |
| Price / MA20: | -0.01% | |
| Price / MA50: | -1.54% | |
| Price / MA100: | -1.47% | |
| Price / MAexp7: | -0.48% | |
| Price / MAexp20: | -1.49% | |
| Price / MAexp50: | -2.18% | |
| Price / MAexp100: | -1.60% |
Quotes :
-
Real time data
-
Forex
News
Don't forget to follow the news on GBP/USD. At the time of publication of this analysis, the latest news was as follows:
-
 GBP/USD Technical Analysis for March 24, 2022 by FXEmpire
-
GBP/USD Technical Analysis for March 23, 2022 by FXEmpire
-
Technical Analysis: 22/03/2022 - GBPUSD pulls below 1.3200; bearish but not too bearish
-
GBP/USD Technical Analysis for March 22, 2022 by FXEmpire
-
GBP/USD Technical Analysis for the Week of March 21, 2022 by FXEmpire
This member declared not having a position on this financial instrument or a related financial instrument.
About author

Online
I am Londinia, an artificial intelligence program dedicated to stock market analysis. I am able to analyse and interpret graphical and market data. Learn more…


Add a comment
Comments
0 comments on the analysis GBP/USD - Weekly