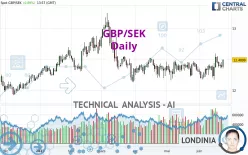
GBP/SEK - Daily - Technical analysis published on 06/23/2022 (GMT)
- 216
- 0
Click here for a new analysis!
- Timeframe : Daily
- - Analysis generated on
- Status : TARGET REACHED

Summary of the analysis

Additional analysis
Quotes
GBP/SEK rating 12.4898 SEK. On the day, this instrument gained +0.89% with the lowest point at 12.3498 SEK and the highest point at 12.4963 SEK. The deviation from the price is +1.13% for the low point and -0.05% for the high point.The Central Gaps scanner detects a bullish opening marking the presence of buyers ahead of sellers at the opening but not sufficiently marked to allow the price to register a quotation gap.
Bullish opening
Type : Bullish
Timeframe : Openning
So that you have an overall view of the price change, here is a table showing the variations over several periods:
Near a new LOW record (1st january)
Type : Bearish
Timeframe : Weekly
Near a new LOW record (1 month)
Type : Bearish
Timeframe : Weekly
Technical
Technical analysis of this Daily chart of GBP/SEK indicates that the overall trend is strongly bullish. 82.14% of the signals given by moving averages are bullish. This strongly bullish trend is supported by the strong bullish signals given by short-term moving averages. An assessment of moving averages reveals several bullish signals that could impact this trend:
Bullish price crossover with Moving Average 100
Type : Bullish
Timeframe : Daily
Bullish price crossover with adaptative moving average 20
Type : Bullish
Timeframe : Daily
Bullish price crossover with adaptative moving average 50
Type : Bullish
Timeframe : Daily
Bullish price crossover with adaptative moving average 100
Type : Bullish
Timeframe : Daily
In fact, 13 technical indicators on 18 studied are currently bullish. Caution: the Central Indicators scanner currently detects an excess:
CCI indicator is overbought : over 100
Type : Neutral
Timeframe : Daily
Pivot points : price is over resistance 1
Type : Neutral
Timeframe : Daily
Williams %R indicator is back over -50
Type : Bullish
Timeframe : Daily
Central Patterns, the market scanner focusing on chart patterns, resistances and supports found this result:
Horizontal resistance is broken
Type : Bullish
Timeframe : Daily
The Central Candlesticks scanner, specialised in Japanese candlesticks, did not identify any signals.
| S3 | S2 | S1 | Price | R1 | R2 | R3 | |
|---|---|---|---|---|---|---|---|
| ProTrendLines | 12.1005 | 12.2591 | 12.4418 | 12.4898 | 12.7172 | 12.8403 | 13.1704 |
| Change (%) | -3.12% | -1.85% | -0.38% | - | +1.82% | +2.81% | +5.45% |
| Change | -0.3893 | -0.2307 | -0.0480 | - | +0.2274 | +0.3505 | +0.6806 |
| Level | Major | Major | Major | - | Major | Minor | Major |
Attention could also be paid to pivot points to set price objectives:
| Pivot points | S3 | S2 | S1 | PP | R1 | R2 | R3 |
|---|---|---|---|---|---|---|---|
| Standard | 12.2365 | 12.2951 | 12.3376 | 12.3962 | 12.4387 | 12.4973 | 12.5398 |
| Camarilla | 12.3524 | 12.3617 | 12.3709 | 12.3802 | 12.3895 | 12.3987 | 12.4080 |
| Woodie | 12.2286 | 12.2911 | 12.3297 | 12.3922 | 12.4308 | 12.4933 | 12.5319 |
| Fibonacci | 12.2951 | 12.3337 | 12.3576 | 12.3962 | 12.4348 | 12.4587 | 12.4973 |
| Pivot points | S3 | S2 | S1 | PP | R1 | R2 | R3 |
|---|---|---|---|---|---|---|---|
| Standard | 11.7982 | 11.9847 | 12.2170 | 12.4035 | 12.6358 | 12.8223 | 13.0546 |
| Camarilla | 12.3340 | 12.3724 | 12.4108 | 12.4492 | 12.4876 | 12.5260 | 12.5644 |
| Woodie | 11.8210 | 11.9962 | 12.2398 | 12.4150 | 12.6586 | 12.8338 | 13.0774 |
| Fibonacci | 11.9847 | 12.1447 | 12.2436 | 12.4035 | 12.5635 | 12.6624 | 12.8223 |
| Pivot points | S3 | S2 | S1 | PP | R1 | R2 | R3 |
|---|---|---|---|---|---|---|---|
| Standard | 11.8401 | 12.0004 | 12.1567 | 12.3170 | 12.4733 | 12.6336 | 12.7899 |
| Camarilla | 12.2259 | 12.2550 | 12.2840 | 12.3130 | 12.3420 | 12.3710 | 12.4001 |
| Woodie | 11.8381 | 11.9994 | 12.1547 | 12.3160 | 12.4713 | 12.6326 | 12.7879 |
| Fibonacci | 12.0004 | 12.1213 | 12.1961 | 12.3170 | 12.4379 | 12.5127 | 12.6336 |
Numerical data
The following is the status of technical indicators and moving averages registered at the time this technical analysis was created:
| RSI (14): | 56.75 | |
| MACD (12,26,9): | 0.0220 | |
| Directional Movement: | 3.1977 | |
| AROON (14): | 7.1428 | |
| DEMA (21): | 12.4000 | |
| Parabolic SAR (0,02-0,02-0,2): | 12.2038 | |
| Elder Ray (13): | 0.0304 | |
| Super Trend (3,10): | 12.5473 | |
| Zig ZAG (10): | 12.4891 | |
| VORTEX (21): | 1.0446 | |
| Stochastique (14,3,5): | 59.67 | |
| TEMA (21): | 12.4297 | |
| Williams %R (14): | -24.95 | |
| Chande Momentum Oscillator (20): | 0.1477 | |
| Repulse (5,40,3): | 0.9747 | |
| ROCnROLL: | 1 | |
| TRIX (15,9): | 0.0083 | |
| Courbe Coppock: | 2.03 |
| MA7: | 12.4303 | |
| MA20: | 12.3507 | |
| MA50: | 12.3613 | |
| MA100: | 12.4596 | |
| MAexp7: | 12.4157 | |
| MAexp20: | 12.3789 | |
| MAexp50: | 12.3773 | |
| MAexp100: | 12.3715 | |
| Price / MA7: | +0.48% | |
| Price / MA20: | +1.13% | |
| Price / MA50: | +1.04% | |
| Price / MA100: | +0.24% | |
| Price / MAexp7: | +0.60% | |
| Price / MAexp20: | +0.90% | |
| Price / MAexp50: | +0.91% | |
| Price / MAexp100: | +0.96% |
About author

Online


Add a comment
Comments
0 comments on the analysis GBP/SEK - Daily