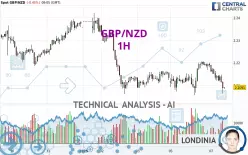
GBP/NZD - 1H - Technical analysis published on 01/07/2025 (GMT)
- 88
- 0
Click here for a new analysis!
- Timeframe : 1H
- - Analysis generated on
- Status : INVALID

Summary of the analysis

Additional analysis
Quotes
GBP/NZD rating 2.2087 NZD. The price is lower by -0.46% since the last closing and was traded between 2.2064 NZD and 2.2191 NZD over the period. The price is currently at +0.10% from its lowest and -0.47% from its highest.Here is a more detailed summary of the historical variations registered by GBP/NZD:
Near a new HIGH record (5 years)
Type : Bullish
Timeframe : Weekly
Near a new HIGH record (1 year)
Type : Bullish
Timeframe : Weekly
Near a new HIGH record (1st january)
Type : Bullish
Timeframe : Weekly
Near a new LOW record (1 month)
Type : Bearish
Timeframe : Weekly
Technical
Technical analysis of this 1H chart of GBP/NZD indicates that the overall trend is strongly bearish. The signals given by moving averages are 89.29% bearish. This strong bearish trend is confirmed by the strong signals currently being given by short-term moving averages. The Central Indicators market scanner currently does not detect any result that concerns moving averages.
Technical indicators are strongly bearish, suggesting that the price decline is expected to continue.
Central Indicators, the scanner specialised in technical indicators, has identified this signal:
Pivot points : price is under support 1
Type : Neutral
Timeframe : 1 hour
Central Patterns, the market scanner focusing on chart patterns, resistances and supports found these results:
Near resistance of channel
Type : Bearish
Timeframe : 1 hour
Near resistance of triangle
Type : Bearish
Timeframe : 1 hour
No result was found by the Central Candlesticks scanner on Japanese candlesticks.
| S3 | S2 | S1 | Price | R1 | R2 | R3 | |
|---|---|---|---|---|---|---|---|
| ProTrendLines | 2.1446 | 2.1883 | 2.2058 | 2.2087 | 2.2107 | 2.2157 | 2.2206 |
| Change (%) | -2.90% | -0.92% | -0.13% | - | +0.09% | +0.32% | +0.54% |
| Change | -0.0641 | -0.0204 | -0.0029 | - | +0.0020 | +0.0070 | +0.0119 |
| Level | Minor | Intermediate | Major | - | Minor | Minor | Intermediate |
To determine price objectives, it is also possible to use the pivot points. Here is the price position in relation to pivot points:
| Pivot points | S3 | S2 | S1 | PP | R1 | R2 | R3 |
|---|---|---|---|---|---|---|---|
| Standard | 2.1944 | 2.2000 | 2.2095 | 2.2151 | 2.2246 | 2.2302 | 2.2397 |
| Camarilla | 2.2149 | 2.2162 | 2.2176 | 2.2190 | 2.2204 | 2.2218 | 2.2232 |
| Woodie | 2.1964 | 2.2010 | 2.2115 | 2.2161 | 2.2266 | 2.2312 | 2.2417 |
| Fibonacci | 2.2000 | 2.2058 | 2.2093 | 2.2151 | 2.2209 | 2.2244 | 2.2302 |
| Pivot points | S3 | S2 | S1 | PP | R1 | R2 | R3 |
|---|---|---|---|---|---|---|---|
| Standard | 2.1629 | 2.1845 | 2.1989 | 2.2205 | 2.2349 | 2.2565 | 2.2709 |
| Camarilla | 2.2034 | 2.2067 | 2.2100 | 2.2133 | 2.2166 | 2.2199 | 2.2232 |
| Woodie | 2.1593 | 2.1827 | 2.1953 | 2.2187 | 2.2313 | 2.2547 | 2.2673 |
| Fibonacci | 2.1845 | 2.1983 | 2.2068 | 2.2205 | 2.2343 | 2.2428 | 2.2565 |
| Pivot points | S3 | S2 | S1 | PP | R1 | R2 | R3 |
|---|---|---|---|---|---|---|---|
| Standard | 2.0805 | 2.1142 | 2.1751 | 2.2088 | 2.2697 | 2.3034 | 2.3643 |
| Camarilla | 2.2099 | 2.2186 | 2.2272 | 2.2359 | 2.2446 | 2.2532 | 2.2619 |
| Woodie | 2.0940 | 2.1210 | 2.1886 | 2.2156 | 2.2832 | 2.3102 | 2.3778 |
| Fibonacci | 2.1142 | 2.1504 | 2.1727 | 2.2088 | 2.2450 | 2.2673 | 2.3034 |
Numerical data
The following are the details of the technical indicators and moving averages that were collected to generate this technical analysis:
| RSI (14): | 35.19 | |
| MACD (12,26,9): | -0.0008 | |
| Directional Movement: | -20.0302 | |
| AROON (14): | -100.0000 | |
| DEMA (21): | 2.2137 | |
| Parabolic SAR (0,02-0,02-0,2): | 2.2186 | |
| Elder Ray (13): | -0.0048 | |
| Super Trend (3,10): | 2.2183 | |
| Zig ZAG (10): | 2.2082 | |
| VORTEX (21): | 0.9423 | |
| Stochastique (14,3,5): | 12.54 | |
| TEMA (21): | 2.2128 | |
| Williams %R (14): | -85.21 | |
| Chande Momentum Oscillator (20): | -0.0111 | |
| Repulse (5,40,3): | -0.2613 | |
| ROCnROLL: | 2 | |
| TRIX (15,9): | 0.0028 | |
| Courbe Coppock: | 0.40 |
| MA7: | 2.2210 | |
| MA20: | 2.2130 | |
| MA50: | 2.1811 | |
| MA100: | 2.1553 | |
| MAexp7: | 2.2124 | |
| MAexp20: | 2.2143 | |
| MAexp50: | 2.2152 | |
| MAexp100: | 2.2177 | |
| Price / MA7: | -0.55% | |
| Price / MA20: | -0.19% | |
| Price / MA50: | +1.27% | |
| Price / MA100: | +2.48% | |
| Price / MAexp7: | -0.16% | |
| Price / MAexp20: | -0.24% | |
| Price / MAexp50: | -0.28% | |
| Price / MAexp100: | -0.40% |
News
The latest news and videos published on GBP/NZD at the time of the analysis were as follows:
-
 GBP/NZD Forecast September 27, 2024
-
Why I'm looking to buy GBPNZD: Coleman
-
Why I'm looking to buy GBPNZD: Coleman
-
GBP/NZD: Pound Has Upperhand
-
Forex Trading Video: GBP/NZD The Cross Roads of BoE and RBNZ, Dollar Faces Wave of Data
About author

Online


Add a comment
Comments
0 comments on the analysis GBP/NZD - 1H