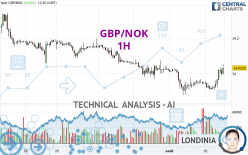
GBP/NOK - 1H - Technical analysis published on 08/02/2024 (GMT)
- 126
- 0
Click here for a new analysis!
- Timeframe : 1H
- - Analysis generated on
- Status : TARGET REACHED

Summary of the analysis

Additional analysis
Quotes
GBP/NOK rating 14.0313 NOK. On the day, this instrument gained +0.61% and was traded between 13.9052 NOK and 14.0552 NOK over the period. The price is currently at +0.91% from its lowest and -0.17% from its highest.A study of price movements over other periods shows the following variations:
Near a new HIGH record (5 years)
Type : Bullish
Timeframe : Weekly
Near a new HIGH record (1 year)
Type : Bullish
Timeframe : Weekly
Near a new HIGH record (1st january)
Type : Bullish
Timeframe : Weekly
Near a new LOW record (1 month)
Type : Bearish
Timeframe : Weekly
Technical
A technical analysis in 1H of this GBP/NOK chart shows a slightly bearish trend. 53.57% of the signals given by moving averages are bearish. Caution: the strong bullish signals currently being given by short-term moving averages indicate that this slightly bearish trend could quickly be reversed. An assessment of moving averages reveals several bearish and bullish signals:
Bearish trend reversal : Moving Average 50
Type : Bearish
Timeframe : 1 hour
Bullish price crossover with Moving Average 100
Type : Bullish
Timeframe : 1 hour
Technical indicators are strongly bullish, suggesting that the price increase should continue.
Caution: the Central Indicators scanner currently detects an excess:
RSI indicator is overbought : over 70
Type : Neutral
Timeframe : 1 hour
CCI indicator is overbought : over 100
Type : Neutral
Timeframe : 1 hour
Williams %R indicator is overbought : over -20
Type : Neutral
Timeframe : 1 hour
Pivot points : price is over resistance 1
Type : Neutral
Timeframe : 1 hour
Ichimoku : price is over the cloud
Type : Bullish
Timeframe : 1 hour
An analysis of the price chart with the Central Patterns scanner (detector of chart patterns and resistances and supports) shows several results that can have an impact on the price change:
Near horizontal resistance
Type : Bearish
Timeframe : 1 hour
Resistance of channel is broken
Type : Bullish
Timeframe : 1 hour
For a small rebound in the very short term, the Central Candlesticks scanner currently notes the presence of this bullish pattern in Japanese candlesticks:
Bullish engulfing lines
Type : Bullish
Timeframe : 1 hour
| S3 | S2 | S1 | Price | R1 | R2 | R3 | |
|---|---|---|---|---|---|---|---|
| ProTrendLines | 13.6262 | 13.8816 | 13.9745 | 14.0313 | 14.0574 | 14.2244 | 14.3424 |
| Change (%) | -2.89% | -1.07% | -0.40% | - | +0.19% | +1.38% | +2.22% |
| Change | -0.4051 | -0.1497 | -0.0568 | - | +0.0261 | +0.1931 | +0.3111 |
| Level | Intermediate | Major | Intermediate | - | Minor | Major | Minor |
Attention could also be paid to pivot points to set price objectives:
| Pivot points | S3 | S2 | S1 | PP | R1 | R2 | R3 |
|---|---|---|---|---|---|---|---|
| Standard | 13.7202 | 13.7991 | 13.8726 | 13.9515 | 14.0250 | 14.1039 | 14.1774 |
| Camarilla | 13.9042 | 13.9182 | 13.9321 | 13.9461 | 13.9601 | 13.9740 | 13.9880 |
| Woodie | 13.7175 | 13.7978 | 13.8699 | 13.9502 | 14.0223 | 14.1026 | 14.1747 |
| Fibonacci | 13.7991 | 13.8573 | 13.8933 | 13.9515 | 14.0097 | 14.0457 | 14.1039 |
| Pivot points | S3 | S2 | S1 | PP | R1 | R2 | R3 |
|---|---|---|---|---|---|---|---|
| Standard | 13.7532 | 13.9025 | 14.0439 | 14.1932 | 14.3346 | 14.4839 | 14.6253 |
| Camarilla | 14.1055 | 14.1321 | 14.1588 | 14.1854 | 14.2121 | 14.2387 | 14.2653 |
| Woodie | 13.7494 | 13.9005 | 14.0401 | 14.1912 | 14.3308 | 14.4819 | 14.6215 |
| Fibonacci | 13.9025 | 14.0135 | 14.0821 | 14.1932 | 14.3042 | 14.3728 | 14.4839 |
| Pivot points | S3 | S2 | S1 | PP | R1 | R2 | R3 |
|---|---|---|---|---|---|---|---|
| Standard | 12.6236 | 13.0319 | 13.5258 | 13.9341 | 14.4280 | 14.8363 | 15.3302 |
| Camarilla | 13.7716 | 13.8543 | 13.9370 | 14.0197 | 14.1024 | 14.1851 | 14.2678 |
| Woodie | 12.6664 | 13.0533 | 13.5686 | 13.9555 | 14.4708 | 14.8577 | 15.3730 |
| Fibonacci | 13.0319 | 13.3765 | 13.5895 | 13.9341 | 14.2787 | 14.4917 | 14.8363 |
Numerical data
The following is the status of the technical indicators and moving averages at the time of publication of this technical analysis:
| RSI (14): | 64.02 | |
| MACD (12,26,9): | 0.0087 | |
| Directional Movement: | 11.3079 | |
| AROON (14): | 28.5714 | |
| DEMA (21): | 13.9710 | |
| Parabolic SAR (0,02-0,02-0,2): | 13.9258 | |
| Elder Ray (13): | 0.0374 | |
| Super Trend (3,10): | 13.9277 | |
| Zig ZAG (10): | 14.0280 | |
| VORTEX (21): | 1.1404 | |
| Stochastique (14,3,5): | 83.48 | |
| TEMA (21): | 13.9975 | |
| Williams %R (14): | -2.49 | |
| Chande Momentum Oscillator (20): | 0.0890 | |
| Repulse (5,40,3): | 0.4008 | |
| ROCnROLL: | 1 | |
| TRIX (15,9): | -0.0040 | |
| Courbe Coppock: | 0.62 |
| MA7: | 14.0849 | |
| MA20: | 13.9960 | |
| MA50: | 13.6853 | |
| MA100: | 13.6521 | |
| MAexp7: | 13.9965 | |
| MAexp20: | 13.9648 | |
| MAexp50: | 13.9807 | |
| MAexp100: | 14.0231 | |
| Price / MA7: | -0.38% | |
| Price / MA20: | +0.25% | |
| Price / MA50: | +2.53% | |
| Price / MA100: | +2.78% | |
| Price / MAexp7: | +0.25% | |
| Price / MAexp20: | +0.48% | |
| Price / MAexp50: | +0.36% | |
| Price / MAexp100: | +0.06% |
About author
Online


Add a comment
Comments
0 comments on the analysis GBP/NOK - 1H