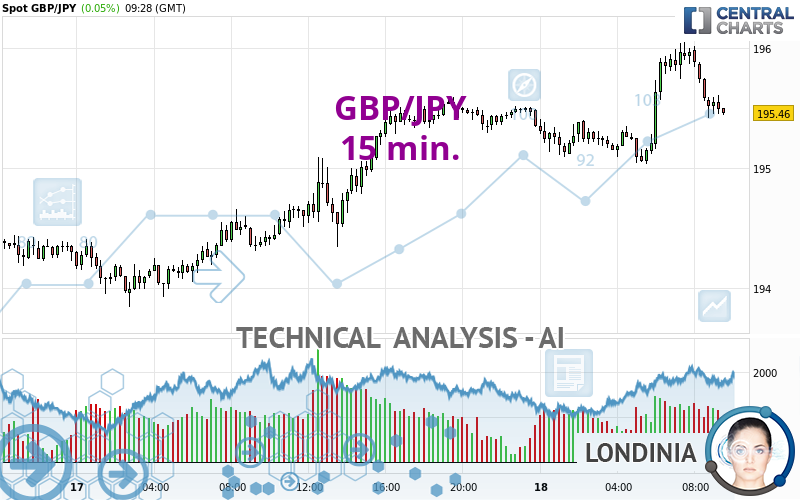
GBP/JPY - 15 min. - Technical analysis published on 10/18/2024 (GMT)
- 79
- 0
Click here for a new analysis!
- Timeframe : 15 min.
- - Analysis generated on
- Status : LEVEL MAINTAINED

Summary of the analysis

Additional analysis
Quotes
The GBP/JPY rating is 195.46 JPY. The price has increased by +0.05% since the last closing and was traded between 195.03 JPY and 196.05 JPY over the period. The price is currently at +0.22% from its lowest and -0.30% from its highest.A bearish opening was detected by the Central Gaps scanner. Sellers are trying to impose a bearish trend in the very short term.
Bearish opening
Type : Bearish
Timeframe : Openning
So that you have an overall view of the price change, here is a table showing the variations over several periods:
New HIGH record (1 month)
Type : Bullish
Timeframe : Weekly
Technical
Technical analysis of GBP/JPY in 15 min. shows an overall bullish trend. 75.00% of the signals given by moving averages are bullish. Caution: the neutral signals currently given by short-term moving averages show us that the global trend is losing momentum. The Central Indicators scanner detects bullish and bearish signals on moving averages that could impact this trend:
Moving Average bearish crossovers : AMA50 & AMA100
Type : Bearish
Timeframe : 15 minutes
Bullish price crossover with Moving Average 20
Type : Bullish
Timeframe : 15 minutes
An assessment of technical indicators does not currently provide any relevant information to suggest whether the signal given by the technical indicators is more bullish or bearish.
Central Indicators, the detector scanner for these technical indicators has recently detected several signals:
RSI indicator is back over 50
Type : Bullish
Timeframe : 15 minutes
Momentum indicator is back under 0
Type : Bearish
Timeframe : 15 minutes
The analysis of the price chart with Central Patterns scanners does not return any result.
The Central Candlesticks scanner which studies Japanese candlesticks did not detect anything.
| S3 | S2 | S1 | Price | R1 | R2 | R3 | |
|---|---|---|---|---|---|---|---|
| ProTrendLines | 193.85 | 194.64 | 195.25 | 195.46 | 195.83 | 198.13 | 200.65 |
| Change (%) | -0.82% | -0.42% | -0.11% | - | +0.19% | +1.37% | +2.66% |
| Change | -1.61 | -0.82 | -0.21 | - | +0.37 | +2.67 | +5.19 |
| Level | Intermediate | Minor | Intermediate | - | Major | Minor | Intermediate |
To determine price objectives, it is also possible to use the pivot points. Here is the price position in relation to pivot points:
| Pivot points | S3 | S2 | S1 | PP | R1 | R2 | R3 |
|---|---|---|---|---|---|---|---|
| Standard | 192.51 | 193.17 | 194.27 | 194.93 | 196.03 | 196.69 | 197.79 |
| Camarilla | 194.88 | 195.04 | 195.20 | 195.36 | 195.52 | 195.68 | 195.84 |
| Woodie | 192.72 | 193.28 | 194.48 | 195.04 | 196.24 | 196.80 | 198.00 |
| Fibonacci | 193.17 | 193.85 | 194.26 | 194.93 | 195.61 | 196.02 | 196.69 |
| Pivot points | S3 | S2 | S1 | PP | R1 | R2 | R3 |
|---|---|---|---|---|---|---|---|
| Standard | 190.60 | 191.74 | 193.33 | 194.47 | 196.06 | 197.20 | 198.79 |
| Camarilla | 194.16 | 194.41 | 194.66 | 194.91 | 195.16 | 195.41 | 195.66 |
| Woodie | 190.82 | 191.85 | 193.55 | 194.58 | 196.28 | 197.31 | 199.01 |
| Fibonacci | 191.74 | 192.79 | 193.43 | 194.47 | 195.52 | 196.16 | 197.20 |
| Pivot points | S3 | S2 | S1 | PP | R1 | R2 | R3 |
|---|---|---|---|---|---|---|---|
| Standard | 173.08 | 178.40 | 185.33 | 190.65 | 197.58 | 202.90 | 209.83 |
| Camarilla | 188.89 | 190.01 | 191.14 | 192.26 | 193.38 | 194.51 | 195.63 |
| Woodie | 173.89 | 178.80 | 186.14 | 191.05 | 198.39 | 203.30 | 210.64 |
| Fibonacci | 178.40 | 183.08 | 185.97 | 190.65 | 195.33 | 198.22 | 202.90 |
Numerical data
The following is the status of technical indicators and moving averages registered at the time this technical analysis was created:
| RSI (14): | 49.45 | |
| MACD (12,26,9): | 0.0900 | |
| Directional Movement: | -5.54 | |
| AROON (14): | 57.14 | |
| DEMA (21): | 195.71 | |
| Parabolic SAR (0,02-0,02-0,2): | 196.01 | |
| Elder Ray (13): | -0.12 | |
| Super Trend (3,10): | 195.45 | |
| Zig ZAG (10): | 195.58 | |
| VORTEX (21): | 1.1000 | |
| Stochastique (14,3,5): | 46.11 | |
| TEMA (21): | 195.75 | |
| Williams %R (14): | -51.11 | |
| Chande Momentum Oscillator (20): | -0.04 | |
| Repulse (5,40,3): | 0.0000 | |
| ROCnROLL: | -1 | |
| TRIX (15,9): | 0.0100 | |
| Courbe Coppock: | 0.43 |
| MA7: | 194.96 | |
| MA20: | 193.70 | |
| MA50: | 190.99 | |
| MA100: | 195.36 | |
| MAexp7: | 195.58 | |
| MAexp20: | 195.58 | |
| MAexp50: | 195.43 | |
| MAexp100: | 195.22 | |
| Price / MA7: | +0.26% | |
| Price / MA20: | +0.91% | |
| Price / MA50: | +2.34% | |
| Price / MA100: | +0.05% | |
| Price / MAexp7: | -0.06% | |
| Price / MAexp20: | -0.06% | |
| Price / MAexp50: | +0.02% | |
| Price / MAexp100: | +0.12% |
News
The last news published on GBP/JPY at the time of the generation of this analysis was as follows:
-
 GBP/JPY Forecast October 14, 2024
-
GBP/JPY Forecast September 26, 2024
-
GBP/JPY Forecast September 11, 2024
-
GBP/JPY Forecast August 15, 2024
-
GBP/JPY Forecast August 12, 2024
About author

Online


Add a comment
Comments
0 comments on the analysis GBP/JPY - 15 min.