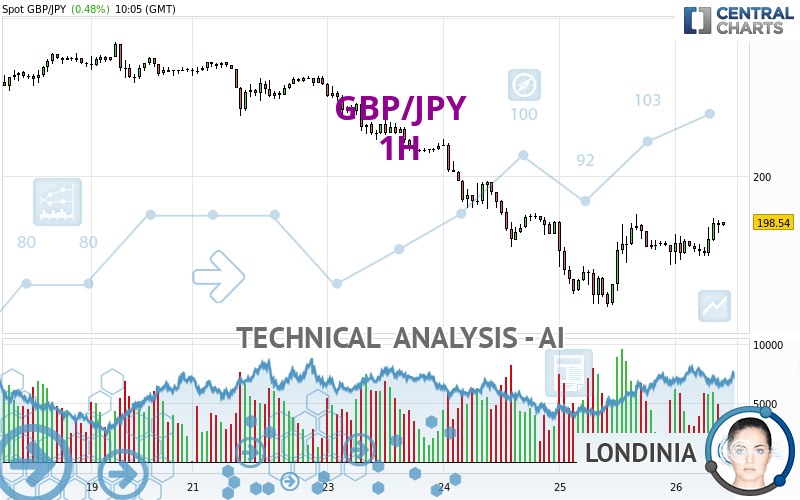
GBP/JPY - 1H - Technical analysis published on 07/26/2024 (GMT)
- 84
- 0
Click here for a new analysis!
- Timeframe : 1H
- - Analysis generated on
- Status : INVALID

Summary of the analysis

Additional analysis
Quotes
The GBP/JPY price is 198.54 JPY. On the day, this instrument gained +0.48% with the lowest point at 197.21 JPY and the highest point at 198.67 JPY. The deviation from the price is +0.67% for the low point and -0.07% for the high point.Here is a more detailed summary of the historical variations registered by GBP/JPY:
Near a new HIGH record (5 years)
Type : Bullish
Timeframe : Weekly
Near a new HIGH record (1 year)
Type : Bullish
Timeframe : Weekly
Near a new HIGH record (1st january)
Type : Bullish
Timeframe : Weekly
Near a new HIGH record (1 month)
Type : Bullish
Timeframe : Weekly
Technical
A technical analysis in 1H of this GBP/JPY chart shows a slightly bearish trend. 53.57% of the signals given by moving averages are bearish. Caution: the strong bullish signals currently being given by short-term moving averages could quickly lead to a reversal of the trend. The Central Indicators scanner detects bullish signals on moving averages that could impact this trend:
Moving Average bullish crossovers : MA20 & MA50
Type : Bullish
Timeframe : 1 hour
Moving Average bullish crossovers : AMA20 & AMA50
Type : Bullish
Timeframe : 1 hour
An assessment of technical indicators shows a strong bullish signal.
But beware of excesses. The Central Indicators scanner currently detects this:
CCI indicator is overbought : over 100
Type : Neutral
Timeframe : 1 hour
RSI indicator: bearish divergence
Type : Bearish
Timeframe : 1 hour
Williams %R indicator is overbought : over -20
Type : Neutral
Timeframe : 1 hour
Pivot points : price is under support 3
Type : Neutral
Timeframe : Weekly
Central Patterns, the scanner specializing in chart patterns, did not identify any signals.
The Central Candlesticks scanner, specialised in Japanese candlesticks, did not identify any signals.
| S3 | S2 | S1 | Price | R1 | R2 | R3 | |
|---|---|---|---|---|---|---|---|
| ProTrendLines | 192.92 | 195.83 | 198.13 | 198.54 | 200.65 | 201.88 | 204.24 |
| Change (%) | -2.83% | -1.36% | -0.21% | - | +1.06% | +1.68% | +2.87% |
| Change | -5.62 | -2.71 | -0.41 | - | +2.11 | +3.34 | +5.70 |
| Level | Minor | Major | Major | - | Minor | Intermediate | Intermediate |
Attention could also be paid to pivot points to set price objectives:
| Pivot points | S3 | S2 | S1 | PP | R1 | R2 | R3 |
|---|---|---|---|---|---|---|---|
| Standard | 193.08 | 194.47 | 196.03 | 197.42 | 198.98 | 200.37 | 201.93 |
| Camarilla | 196.78 | 197.05 | 197.32 | 197.59 | 197.86 | 198.13 | 198.40 |
| Woodie | 193.17 | 194.51 | 196.12 | 197.46 | 199.07 | 200.41 | 202.02 |
| Fibonacci | 194.47 | 195.60 | 196.29 | 197.42 | 198.55 | 199.24 | 200.37 |
| Pivot points | S3 | S2 | S1 | PP | R1 | R2 | R3 |
|---|---|---|---|---|---|---|---|
| Standard | 198.03 | 200.06 | 201.72 | 203.75 | 205.41 | 207.44 | 209.10 |
| Camarilla | 202.36 | 202.69 | 203.03 | 203.37 | 203.71 | 204.05 | 204.39 |
| Woodie | 197.84 | 199.97 | 201.53 | 203.66 | 205.22 | 207.35 | 208.91 |
| Fibonacci | 200.06 | 201.47 | 202.34 | 203.75 | 205.16 | 206.03 | 207.44 |
| Pivot points | S3 | S2 | S1 | PP | R1 | R2 | R3 |
|---|---|---|---|---|---|---|---|
| Standard | 192.81 | 195.00 | 199.20 | 201.39 | 205.59 | 207.78 | 211.98 |
| Camarilla | 201.63 | 202.22 | 202.80 | 203.39 | 203.98 | 204.56 | 205.15 |
| Woodie | 193.81 | 195.50 | 200.20 | 201.89 | 206.59 | 208.28 | 212.98 |
| Fibonacci | 195.00 | 197.44 | 198.95 | 201.39 | 203.83 | 205.34 | 207.78 |
Numerical data
The following is the status of the technical indicators and moving averages at the time of publication of this technical analysis:
| RSI (14): | 57.89 | |
| MACD (12,26,9): | 0.0700 | |
| Directional Movement: | 6.60 | |
| AROON (14): | 64.29 | |
| DEMA (21): | 197.90 | |
| Parabolic SAR (0,02-0,02-0,2): | 197.23 | |
| Elder Ray (13): | 0.48 | |
| Super Trend (3,10): | 196.83 | |
| Zig ZAG (10): | 198.40 | |
| VORTEX (21): | 1.1700 | |
| Stochastique (14,3,5): | 79.74 | |
| TEMA (21): | 198.23 | |
| Williams %R (14): | -17.69 | |
| Chande Momentum Oscillator (20): | 0.53 | |
| Repulse (5,40,3): | 0.2200 | |
| ROCnROLL: | -1 | |
| TRIX (15,9): | 0.0000 | |
| Courbe Coppock: | 0.07 |
| MA7: | 200.75 | |
| MA20: | 203.76 | |
| MA50: | 201.78 | |
| MA100: | 197.19 | |
| MAexp7: | 198.07 | |
| MAexp20: | 197.87 | |
| MAexp50: | 198.28 | |
| MAexp100: | 199.48 | |
| Price / MA7: | -1.10% | |
| Price / MA20: | -2.56% | |
| Price / MA50: | -1.61% | |
| Price / MA100: | +0.68% | |
| Price / MAexp7: | +0.24% | |
| Price / MAexp20: | +0.34% | |
| Price / MAexp50: | +0.13% | |
| Price / MAexp100: | -0.47% |
News
The last news published on GBP/JPY at the time of the generation of this analysis was as follows:
-
 GBP/JPY Forecast July 24, 2024
-
GBP/JPY Forecast July 22, 2024
-
GBP/JPY Forecast July 19, 2024
-
GBP/JPY Forecast July 10, 2024
-
GBP/JPY Forecast July 2, 2024
About author

Online


Add a comment
Comments
0 comments on the analysis GBP/JPY - 1H