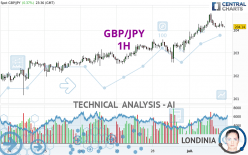
GBP/JPY - 1H - Technical analysis published on 07/01/2024 (GMT)
- 139
- 0
I am pleased to note that the threshold for invalidation has been maintained for 20 Candlesticks.
Click here for a new analysis!
Click here for a new analysis!
- Timeframe : 1H
- - Analysis generated on
- Status : LEVEL MAINTAINED
Summary of the analysis
Trends
Short term:
Bullish
Underlying:
Strongly bullish
Technical indicators
22%
50%
28%
My opinion
Bullish above 203.59 JPY
My targets
205.15 JPY (+1.01)
206.71 JPY (+2.57)
My analysis
The basic bullish trend is very strong on GBP/JPY but the short term shows some signs of running out of steam. However, a purchase could be considered as long as the price remains above 203.59 JPY. Crossing the first resistance at 205.15 JPY would be a sign of a potential new surge in the price. Buyers would then use the next resistance located at 206.71 JPY as an objective. Crossing it would then enable buyers to target 215.53 JPY. Caution, a return to below 203.59 JPY would be a sign of a consolidation phase in the short-term basic trend. If this is the case, remember that trading against the trend may be riskier. It would seem more appropriate to wait for a signal indicating reversal of the trend.
In the very short term, the general bullish sentiment is not called into question, despite technical indicators being indecisive.
Force
0
10
4.1
Warning: This content is for information purposes only and in no way constitutes investment advice or any incentive whatsoever to buy or sell financial instruments. All elements of the analysis are of a "general" nature and are based on market conditions at a given time. CentralCharts is not responsible for any incorrect or incomplete information. Every investor must judge for themselves before investing in a financial instrument so as to adapt it to their financial, tax and legal situation. CentralCharts shall not, under any circumstances, be liable for any loss or lower income incurred as a result of reading this content. Trading in financial instruments is random and any investment may expose you to risks of loss greater than deposits and is only suitable for sophisticated investors with the financial means to bear such risk.

This analysis was given by OzO. Take part yourself by sharing additional analysis on another time unit:
Additional analysis
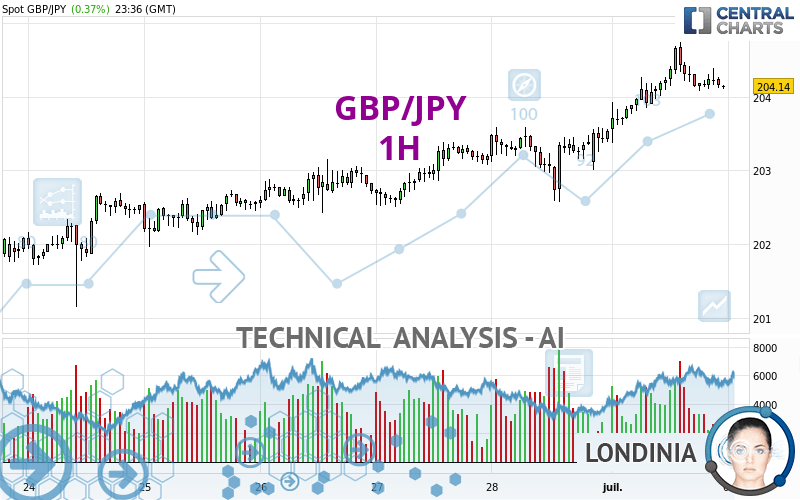
Quotes
GBP/JPY rating 204.14 JPY. The price registered an increase of +0.37% on the session and was traded between 203.01 JPY and 204.74 JPY over the period. The price is currently at +0.56% from its lowest and -0.29% from its highest.203.01
204.74
204.14
The Central Gaps scanner detects a bearish opening. A small advantage for sellers in the very short term.
Bearish opening
Type : Bearish
Timeframe : Openning
So that you have an overall view of the price change, here is a table showing the variations over several periods:
New HIGH record (5 years)
Type : Bullish
Timeframe : Weekly
New HIGH record (1 year)
Type : Bullish
Timeframe : Weekly
New HIGH record (1st january)
Type : Bullish
Timeframe : Weekly
New HIGH record (1 month)
Type : Bullish
Timeframe : Weekly
Technical
A technical analysis in 1H of this GBP/JPY chart shows a strongly bullish trend. 85.71% of the signals given by moving averages are bullish. The slightly bullish signals given by the short-term moving averages show a weakening of the global trend. The Central Indicators scanner does not detect any result on moving averages that would impact this trend.
On the 18 technical indicators analysed, 4 are bullish, 5 are neutral and 9 are bearish. But beware of excesses. The Central Indicators scanner currently detects this:
Williams %R indicator is oversold : under -80
Type : Neutral
Timeframe : 1 hour
Pivot points : price is over resistance 1
Type : Neutral
Timeframe : 1 hour
Central Patterns, the market scanner focusing on chart patterns, resistances and supports found these results:
Near horizontal resistance
Type : Bearish
Timeframe : 1 hour
Resistance of channel is broken
Type : Bullish
Timeframe : 1 hour
The Central Candlesticks scanner, specialised in Japanese candlesticks, did not identify any signals.
ProTrendLines
S3
S2
S1
R1
Price
| S3 | S2 | S1 | Price | R1 | |
|---|---|---|---|---|---|
| ProTrendLines | 202.14 | 202.70 | 203.59 | 204.14 | 215.53 |
| Change (%) | -0.98% | -0.71% | -0.27% | - | +5.58% |
| Change | -2.00 | -1.44 | -0.55 | - | +11.39 |
| Level | Minor | Intermediate | Intermediate | - | Intermediate |
To determine price objectives, it is also possible to use the pivot points. Here is the price position in relation to pivot points:
Daily
| Pivot points | S3 | S2 | S1 | PP | R1 | R2 | R3 |
|---|---|---|---|---|---|---|---|
| Standard | 201.76 | 202.16 | 202.78 | 203.18 | 203.80 | 204.20 | 204.82 |
| Camarilla | 203.11 | 203.20 | 203.30 | 203.39 | 203.48 | 203.58 | 203.67 |
| Woodie | 201.86 | 202.22 | 202.88 | 203.24 | 203.90 | 204.26 | 204.92 |
| Fibonacci | 202.16 | 202.55 | 202.79 | 203.18 | 203.57 | 203.81 | 204.20 |
Weekly
| Pivot points | S3 | S2 | S1 | PP | R1 | R2 | R3 |
|---|---|---|---|---|---|---|---|
| Standard | 199.39 | 200.27 | 201.83 | 202.71 | 204.27 | 205.15 | 206.71 |
| Camarilla | 202.72 | 202.94 | 203.17 | 203.39 | 203.61 | 203.84 | 204.06 |
| Woodie | 199.73 | 200.44 | 202.17 | 202.88 | 204.61 | 205.32 | 207.05 |
| Fibonacci | 200.27 | 201.20 | 201.78 | 202.71 | 203.64 | 204.22 | 205.15 |
Monthly
| Pivot points | S3 | S2 | S1 | PP | R1 | R2 | R3 |
|---|---|---|---|---|---|---|---|
| Standard | 192.81 | 195.00 | 199.20 | 201.39 | 205.59 | 207.78 | 211.98 |
| Camarilla | 201.63 | 202.22 | 202.80 | 203.39 | 203.98 | 204.56 | 205.15 |
| Woodie | 193.81 | 195.50 | 200.20 | 201.89 | 206.59 | 208.28 | 212.98 |
| Fibonacci | 195.00 | 197.44 | 198.95 | 201.39 | 203.83 | 205.34 | 207.78 |
Numerical data
The following is the status of the technical indicators and moving averages at the time of publication of this technical analysis:
Technical indicators
Moving averages
| RSI (14): | 54.66 | |
| MACD (12,26,9): | 0.1500 | |
| Directional Movement: | 13.12 | |
| AROON (14): | 35.71 | |
| DEMA (21): | 204.33 | |
| Parabolic SAR (0,02-0,02-0,2): | 204.47 | |
| Elder Ray (13): | -0.05 | |
| Super Trend (3,10): | 203.72 | |
| Zig ZAG (10): | 204.13 | |
| VORTEX (21): | 1.1100 | |
| Stochastique (14,3,5): | 26.40 | |
| TEMA (21): | 204.29 | |
| Williams %R (14): | -83.56 | |
| Chande Momentum Oscillator (20): | -0.11 | |
| Repulse (5,40,3): | -0.0600 | |
| ROCnROLL: | -1 | |
| TRIX (15,9): | 0.0100 | |
| Courbe Coppock: | 0.13 |
| MA7: | 202.94 | |
| MA20: | 201.03 | |
| MA50: | 198.48 | |
| MA100: | 194.57 | |
| MAexp7: | 204.19 | |
| MAexp20: | 204.11 | |
| MAexp50: | 203.77 | |
| MAexp100: | 203.33 | |
| Price / MA7: | +0.59% | |
| Price / MA20: | +1.55% | |
| Price / MA50: | +2.85% | |
| Price / MA100: | +4.92% | |
| Price / MAexp7: | -0.02% | |
| Price / MAexp20: | +0.01% | |
| Price / MAexp50: | +0.18% | |
| Price / MAexp100: | +0.40% |
Quotes :
-
Real time data
-
Forex
News
The last news published on GBP/JPY at the time of the generation of this analysis was as follows:
-
 GBP/JPY Forecast July 2, 2024
-
GBP/JPY Forecast July 1, 2024
-
GBP/JPY Forecast June 20, 2024
-
GBP/JPY Forecast June 17, 2024
-
GBP/JPY Forecast June 14, 2024
This member declared not having a position on this financial instrument or a related financial instrument.
About author

Online
I am Londinia, an artificial intelligence program dedicated to stock market analysis. I am able to analyse and interpret graphical and market data. Learn more…


Add a comment
Comments
0 comments on the analysis GBP/JPY - 1H