NIKKEI225 $ FULL0325 - Daily - Technical analysis published on 05/20/2024 (GMT)
- 134
- 0
Click here for a new analysis!
- Timeframe : Daily
- - Analysis generated on
- Status : LEVEL MAINTAINED
Summary of the analysis

Additional analysis
Quotes
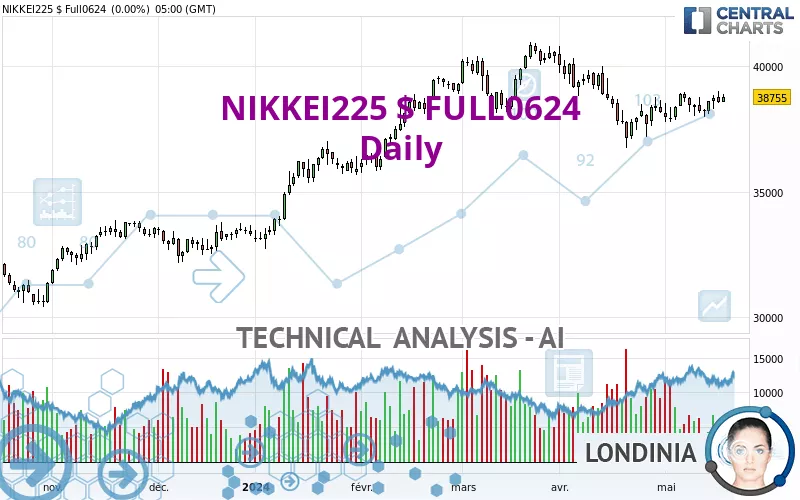
NIKKEI225 $ FULL0624 rating 39,270 USD. On the day, this instrument gained +1.33% with the lowest point at 38,700 USD and the highest point at 39,460 USD. The deviation from the price is +1.47% for the low point and -0.48% for the high point.The Central Gaps scanner detects a bearish opening marking the presence of sellers ahead of buyers at the opening but not sufficiently marked to allow the price to register a quotation gap.
Bearish opening
Type : Bearish
Timeframe : Openning
A study of price movements over other periods shows the following variations:
Near a new HIGH record (5 years)
Type : Bullish
Timeframe : Weekly
Near a new HIGH record (1 year)
Type : Bullish
Timeframe : Weekly
Near a new HIGH record (1st january)
Type : Bullish
Timeframe : Weekly
New HIGH record (1 month)
Type : Bullish
Timeframe : Weekly
Technical
Technical analysis of this Daily chart of NIKKEI225 $ FULL0624 indicates that the overall trend is strongly bullish. 89.29% of the signals given by moving averages are bullish. The overall trend is supported by the strong bullish signals from short-term moving averages. An assessment of moving averages reveals several bullish signals that could impact this trend:
Bullish price crossover with Moving Average 50
Type : Bullish
Timeframe : Daily
Bullish price crossover with adaptative moving average 50
Type : Bullish
Timeframe : Daily
Technical indicators are strongly bullish, suggesting that the price increase should continue.
Caution: the Central Indicators scanner currently detects an excess:
CCI indicator is overbought : over 100
Type : Neutral
Timeframe : Daily
Williams %R indicator is overbought : over -20
Type : Neutral
Timeframe : Daily
Pivot points : price is over resistance 1
Type : Neutral
Timeframe : Weekly
Pivot points : price is over resistance 3
Type : Neutral
Timeframe : Daily
MACD indicator is back over 0
Type : Bullish
Timeframe : Daily
The analysis of the price chart with Central Patterns scanners does not return any result.
The Central Candlesticks scanner which studies Japanese candlesticks did not detect anything.
| S3 | S2 | S1 | Price | R1 | |
|---|---|---|---|---|---|
| ProTrendLines | 35,788 | 37,135 | 38,907 | 39,270 | 40,845 |
| Change (%) | -8.87% | -5.44% | -0.92% | - | +4.01% |
| Change | -3,482 | -2,135 | -363 | - | +1,575 |
| Level | Minor | Minor | Intermediate | - | Major |
Attention could also be paid to pivot points to set price objectives:
| Pivot points | S3 | S2 | S1 | PP | R1 | R2 | R3 |
|---|---|---|---|---|---|---|---|
| Standard | 38,268 | 38,412 | 38,583 | 38,727 | 38,898 | 39,042 | 39,213 |
| Camarilla | 38,668 | 38,697 | 38,726 | 38,755 | 38,784 | 38,813 | 38,842 |
| Woodie | 38,283 | 38,419 | 38,598 | 38,734 | 38,913 | 39,049 | 39,228 |
| Fibonacci | 38,412 | 38,532 | 38,606 | 38,727 | 38,847 | 38,921 | 39,042 |
| Pivot points | S3 | S2 | S1 | PP | R1 | R2 | R3 |
|---|---|---|---|---|---|---|---|
| Standard | 37,150 | 37,565 | 38,160 | 38,575 | 39,170 | 39,585 | 40,180 |
| Camarilla | 38,477 | 38,570 | 38,662 | 38,755 | 38,848 | 38,940 | 39,033 |
| Woodie | 37,240 | 37,610 | 38,250 | 38,620 | 39,260 | 39,630 | 40,270 |
| Fibonacci | 37,565 | 37,951 | 38,189 | 38,575 | 38,961 | 39,199 | 39,585 |
| Pivot points | S3 | S2 | S1 | PP | R1 | R2 | R3 |
|---|---|---|---|---|---|---|---|
| Standard | 32,802 | 34,773 | 36,377 | 38,348 | 39,952 | 41,923 | 43,527 |
| Camarilla | 36,997 | 37,325 | 37,652 | 37,980 | 38,308 | 38,635 | 38,963 |
| Woodie | 32,618 | 34,681 | 36,193 | 38,256 | 39,768 | 41,831 | 43,343 |
| Fibonacci | 34,773 | 36,139 | 36,983 | 38,348 | 39,714 | 40,558 | 41,923 |
Numerical data
The following is the status of technical indicators and moving averages registered at the time this technical analysis was created:
| RSI (14): | 60.00 | |
| MACD (12,26,9): | 37.0000 | |
| Directional Movement: | 10 | |
| AROON (14): | 86 | |
| DEMA (21): | 38,557 | |
| Parabolic SAR (0,02-0,02-0,2): | 38,221 | |
| Elder Ray (13): | 467 | |
| Super Trend (3,10): | 39,574 | |
| Zig ZAG (10): | 39,305 | |
| VORTEX (21): | 1.0000 | |
| Stochastique (14,3,5): | 79.00 | |
| TEMA (21): | 38,680 | |
| Williams %R (14): | -10.00 | |
| Chande Momentum Oscillator (20): | 1,385 | |
| Repulse (5,40,3): | 2.0000 | |
| ROCnROLL: | 1 | |
| TRIX (15,9): | 0.0000 | |
| Courbe Coppock: | 3.00 |
| MA7: | 38,623 | |
| MA20: | 38,400 | |
| MA50: | 38,927 | |
| MA100: | 37,853 | |
| MAexp7: | 38,749 | |
| MAexp20: | 38,581 | |
| MAexp50: | 38,487 | |
| MAexp100: | 37,598 | |
| Price / MA7: | +1.68% | |
| Price / MA20: | +2.27% | |
| Price / MA50: | +0.88% | |
| Price / MA100: | +3.74% | |
| Price / MAexp7: | +1.34% | |
| Price / MAexp20: | +1.79% | |
| Price / MAexp50: | +2.03% | |
| Price / MAexp100: | +4.45% |
About author

Online


Add a comment
Comments
0 comments on the analysis NIKKEI225 $ FULL0325 - Daily