NIKKEI225 $ FULL0625 - Daily - Technical analysis published on 05/15/2024 (GMT)
- 123
- 0
- Timeframe : Daily
- - Analysis generated on
- Status : NEUTRAL

Summary of the analysis

Additional analysis
Quotes
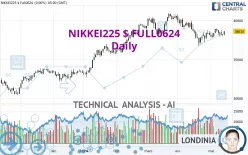
The NIKKEI225 $ FULL0624 rating is 38,410 USD. On the day, this instrument lost -0.52% and was traded between 38,360 USD and 38,850 USD over the period. The price is currently at +0.13% from its lowest and -1.13% from its highest.A bullish opening was detected by the Central Gaps scanner. Buyers are trying to impose a bullish momentum in the very short term.
Bullish opening
Type : Bullish
Timeframe : Openning
Here is a more detailed summary of the historical variations registered by NIKKEI225 $ FULL0624:
Near a new LOW record (1 month)
Type : Bearish
Timeframe : Weekly
Technical
Technical analysis of this Daily chart of NIKKEI225 $ FULL0624 indicates that the overall trend is slightly bullish. Only 53.57% of the signals given by moving averages are bullish. This slightly bullish trend could return to neutral given the neutral signals also given by short-term moving averages. An assessment of moving averages reveals several bearish and bullish signals:
Bullish trend reversal : Moving Average 20
Type : Bullish
Timeframe : Daily
Bearish price crossover with adaptative moving average 20
Type : Bearish
Timeframe : Daily
An assessment of technical indicators shows a slightly bullish signal.
Other results related to technical indicators were also found by the Central Indicators scanner:
RSI indicator is back under 50
Type : Bearish
Timeframe : Daily
Price is back over the pivot point
Type : Bullish
Timeframe : Weekly
Price is back under the pivot point
Type : Bearish
Timeframe : Daily
Central Patterns, the scanner specializing in chart patterns, did not identify any signals.
The Central Candlesticks scanner, specialised in Japanese candlesticks, did not identify any signals.
| S3 | S2 | S1 | Price | R1 | R2 | |
|---|---|---|---|---|---|---|
| ProTrendLines | 33,300 | 35,788 | 37,135 | 38,410 | 38,908 | 40,845 |
| Change (%) | -13.30% | -6.83% | -3.32% | - | +1.30% | +6.34% |
| Change | -5,110 | -2,622 | -1,275 | - | +498 | +2,435 |
| Level | Major | Minor | Minor | - | Intermediate | Major |
To determine price objectives, it is also possible to use the pivot points. Here is the price position in relation to pivot points:
| Pivot points | S3 | S2 | S1 | PP | R1 | R2 | R3 |
|---|---|---|---|---|---|---|---|
| Standard | 37,748 | 37,927 | 38,268 | 38,447 | 38,788 | 38,967 | 39,308 |
| Camarilla | 38,467 | 38,515 | 38,562 | 38,610 | 38,658 | 38,705 | 38,753 |
| Woodie | 37,830 | 37,968 | 38,350 | 38,488 | 38,870 | 39,008 | 39,390 |
| Fibonacci | 37,927 | 38,125 | 38,248 | 38,447 | 38,645 | 38,768 | 38,967 |
| Pivot points | S3 | S2 | S1 | PP | R1 | R2 | R3 |
|---|---|---|---|---|---|---|---|
| Standard | 36,858 | 37,432 | 37,823 | 38,397 | 38,788 | 39,362 | 39,753 |
| Camarilla | 37,950 | 38,038 | 38,127 | 38,215 | 38,303 | 38,392 | 38,480 |
| Woodie | 36,768 | 37,386 | 37,733 | 38,351 | 38,698 | 39,316 | 39,663 |
| Fibonacci | 37,432 | 37,800 | 38,028 | 38,397 | 38,765 | 38,993 | 39,362 |
| Pivot points | S3 | S2 | S1 | PP | R1 | R2 | R3 |
|---|---|---|---|---|---|---|---|
| Standard | 32,802 | 34,773 | 36,377 | 38,348 | 39,952 | 41,923 | 43,527 |
| Camarilla | 36,997 | 37,325 | 37,652 | 37,980 | 38,308 | 38,635 | 38,963 |
| Woodie | 32,618 | 34,681 | 36,193 | 38,256 | 39,768 | 41,831 | 43,343 |
| Fibonacci | 34,773 | 36,139 | 36,983 | 38,348 | 39,714 | 40,558 | 41,923 |
Numerical data
The following are the details of the technical indicators and moving averages that were collected to generate this technical analysis:
| RSI (14): | 49.00 | |
| MACD (12,26,9): | -98.0000 | |
| Directional Movement: | 2 | |
| AROON (14): | 57 | |
| DEMA (21): | 38,267 | |
| Parabolic SAR (0,02-0,02-0,2): | 37,960 | |
| Elder Ray (13): | 215 | |
| Super Trend (3,10): | 39,574 | |
| Zig ZAG (10): | 38,400 | |
| VORTEX (21): | 1.0000 | |
| Stochastique (14,3,5): | 65.00 | |
| TEMA (21): | 38,258 | |
| Williams %R (14): | -41.00 | |
| Chande Momentum Oscillator (20): | 50 | |
| Repulse (5,40,3): | 0.0000 | |
| ROCnROLL: | 1 | |
| TRIX (15,9): | 0.0000 | |
| Courbe Coppock: | 2.00 |
| MA7: | 38,439 | |
| MA20: | 38,187 | |
| MA50: | 38,962 | |
| MA100: | 37,684 | |
| MAexp7: | 38,408 | |
| MAexp20: | 38,437 | |
| MAexp50: | 38,423 | |
| MAexp100: | 37,509 | |
| Price / MA7: | -0.08% | |
| Price / MA20: | +0.58% | |
| Price / MA50: | -1.42% | |
| Price / MA100: | +1.93% | |
| Price / MAexp7: | +0.01% | |
| Price / MAexp20: | -0.07% | |
| Price / MAexp50: | -0.03% | |
| Price / MAexp100: | +2.40% |
About author

Online


Add a comment
Comments
0 comments on the analysis NIKKEI225 $ FULL0625 - Daily