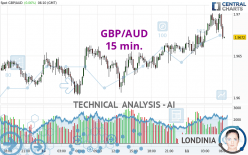
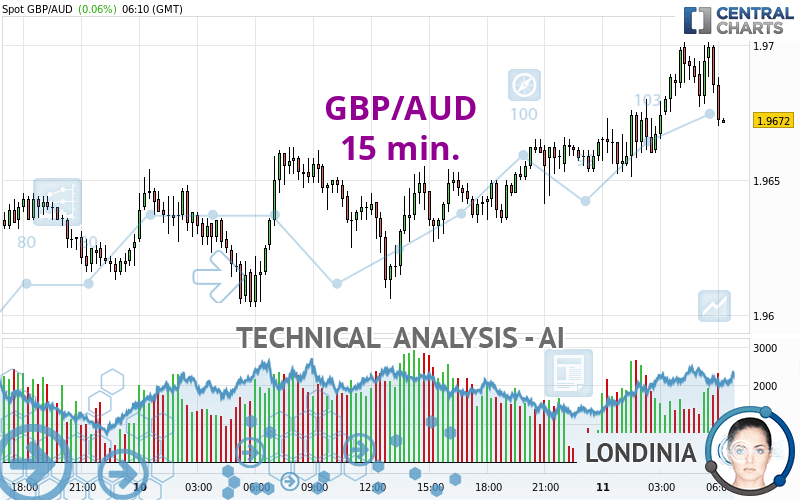
GBP/AUD - 15 min. - Technical analysis published on 09/11/2024 (GMT)
- 71
- 0
Oops, I was wrong about that analysis. My threshold for invalidation has been broken.
Click here for a new analysis!
Click here for a new analysis!
- Timeframe : 15 min.
- - Analysis generated on
- Status : INVALID
Summary of the analysis
Trends
Short term:
Neutral
Underlying:
Bullish
Technical indicators
67%
0%
33%
My opinion
Bullish above 1.9643 AUD
My targets
1.9683 AUD (+0.0011)
1.9706 AUD (+0.0034)
My analysis
We are currently in a phase of short-term indecision. In a case like this, you could favour trades in the direction of the basic trend on GBP/AUD. As long as you are above the support located at 1.9643 AUD, traders with an aggressive trading strategy could consider a purchase. A cross of the resistance located at 1.9683 AUD would be a signal that the basic trade will reverse and the short-term trend could then quickly become bullish. Buyers would then use the next resistance located at 1.9706 AUD as an objective. Crossing it would then enable buyers to target 1.9746 AUD. If the support 1.9643 AUD were to be broken, this would simply be a sign of a possible continuation of short-term consolidation and trading against the trend would then perhaps be more risky.
In the very short term, the general bullish sentiment is confirmed by technical indicators. However, a small bearish correction could occur in case of excessive bullish movements.
Force
0
10
6.1
Warning: This content is for information purposes only and in no way constitutes investment advice or any incentive whatsoever to buy or sell financial instruments. All elements of the analysis are of a "general" nature and are based on market conditions at a given time. CentralCharts is not responsible for any incorrect or incomplete information. Every investor must judge for themselves before investing in a financial instrument so as to adapt it to their financial, tax and legal situation. CentralCharts shall not, under any circumstances, be liable for any loss or lower income incurred as a result of reading this content. Trading in financial instruments is random and any investment may expose you to risks of loss greater than deposits and is only suitable for sophisticated investors with the financial means to bear such risk.

This analysis was given by GCrow. Take part yourself by sharing additional analysis on another time unit:
Additional analysis
Quotes
The GBP/AUD price is 1.9672 AUD. The price registered an increase of +0.06% on the session and was traded between 1.9651 AUD and 1.9701 AUD over the period. The price is currently at +0.11% from its lowest and -0.15% from its highest.1.9651
1.9701
1.9672
A study of price movements over other periods shows the following variations:
Near a new HIGH record (1 year)
Type : Bullish
Timeframe : Weekly
Near a new HIGH record (1st january)
Type : Bullish
Timeframe : Weekly
New HIGH record (1 month)
Type : Bullish
Timeframe : Weekly
Technical
Technical analysis of GBP/AUD in 15 min. shows an overall bullish trend. 78.57% of the signals given by moving averages are bullish. Caution: the neutral signals currently given by short-term moving averages show us that the global trend is losing momentum. The Central Indicators market scanner currently does not detect any result that concerns moving averages.
The probability of a further increase are moderate given the direction of the technical indicators.
Caution: the Central Indicators scanner currently detects an excess:
CCI indicator is overbought : over 100
Type : Neutral
Timeframe : 15 minutes
RSI indicator: bearish divergence
Type : Bearish
Timeframe : 15 minutes
Williams %R indicator is overbought : over -20
Type : Neutral
Timeframe : 15 minutes
Pivot points : price is over resistance 1
Type : Neutral
Timeframe : 15 minutes
No signals are given by Central Patterns, a market scanner specialised in chart patterns, resistances and supports.
No result was found by the Central Candlesticks scanner on Japanese candlesticks.
ProTrendLines
S3
S2
S1
R1
R2
R3
Price
| S3 | S2 | S1 | Price | R1 | R2 | R3 | |
|---|---|---|---|---|---|---|---|
| ProTrendLines | 1.9532 | 1.9602 | 1.9665 | 1.9672 | 1.9701 | 1.9897 | 2.0470 |
| Change (%) | -0.71% | -0.36% | -0.04% | - | +0.15% | +1.14% | +4.06% |
| Change | -0.0140 | -0.0070 | -0.0007 | - | +0.0029 | +0.0225 | +0.0798 |
| Level | Major | Major | Major | - | Intermediate | Intermediate | Intermediate |
Pivot points can also be used to set your price objectives. Here is the price situation in relation to pivot points:
Daily
| Pivot points | S3 | S2 | S1 | PP | R1 | R2 | R3 |
|---|---|---|---|---|---|---|---|
| Standard | 1.9557 | 1.9580 | 1.9620 | 1.9643 | 1.9683 | 1.9706 | 1.9746 |
| Camarilla | 1.9643 | 1.9649 | 1.9654 | 1.9660 | 1.9666 | 1.9672 | 1.9677 |
| Woodie | 1.9566 | 1.9584 | 1.9629 | 1.9647 | 1.9692 | 1.9710 | 1.9755 |
| Fibonacci | 1.9580 | 1.9604 | 1.9619 | 1.9643 | 1.9667 | 1.9682 | 1.9706 |
Weekly
| Pivot points | S3 | S2 | S1 | PP | R1 | R2 | R3 |
|---|---|---|---|---|---|---|---|
| Standard | 1.9103 | 1.9224 | 1.9455 | 1.9576 | 1.9807 | 1.9928 | 2.0159 |
| Camarilla | 1.9590 | 1.9623 | 1.9655 | 1.9687 | 1.9719 | 1.9752 | 1.9784 |
| Woodie | 1.9159 | 1.9252 | 1.9511 | 1.9604 | 1.9863 | 1.9956 | 2.0215 |
| Fibonacci | 1.9224 | 1.9358 | 1.9441 | 1.9576 | 1.9710 | 1.9793 | 1.9928 |
Monthly
| Pivot points | S3 | S2 | S1 | PP | R1 | R2 | R3 |
|---|---|---|---|---|---|---|---|
| Standard | 1.8346 | 1.8811 | 1.9108 | 1.9573 | 1.9870 | 2.0335 | 2.0632 |
| Camarilla | 1.9195 | 1.9264 | 1.9334 | 1.9404 | 1.9474 | 1.9544 | 1.9614 |
| Woodie | 1.8261 | 1.8769 | 1.9023 | 1.9531 | 1.9785 | 2.0293 | 2.0547 |
| Fibonacci | 1.8811 | 1.9102 | 1.9282 | 1.9573 | 1.9864 | 2.0044 | 2.0335 |
Numerical data
The following is the status of technical indicators and moving averages registered at the time this technical analysis was created:
Technical indicators
Moving averages
| RSI (14): | 61.34 | |
| MACD (12,26,9): | 0.0009 | |
| Directional Movement: | 12.6112 | |
| AROON (14): | 57.1429 | |
| DEMA (21): | 1.9691 | |
| Parabolic SAR (0,02-0,02-0,2): | 1.9675 | |
| Elder Ray (13): | 0.0010 | |
| Super Trend (3,10): | 1.9657 | |
| Zig ZAG (10): | 1.9694 | |
| VORTEX (21): | 1.1014 | |
| Stochastique (14,3,5): | 80.84 | |
| TEMA (21): | 1.9696 | |
| Williams %R (14): | -7.32 | |
| Chande Momentum Oscillator (20): | 0.0032 | |
| Repulse (5,40,3): | 0.0541 | |
| ROCnROLL: | 1 | |
| TRIX (15,9): | 0.0057 | |
| Courbe Coppock: | 0.28 |
| MA7: | 1.9616 | |
| MA20: | 1.9488 | |
| MA50: | 1.9419 | |
| MA100: | 1.9261 | |
| MAexp7: | 1.9691 | |
| MAexp20: | 1.9680 | |
| MAexp50: | 1.9667 | |
| MAexp100: | 1.9658 | |
| Price / MA7: | +0.29% | |
| Price / MA20: | +0.94% | |
| Price / MA50: | +1.30% | |
| Price / MA100: | +2.13% | |
| Price / MAexp7: | -0.10% | |
| Price / MAexp20: | -0.04% | |
| Price / MAexp50: | +0.03% | |
| Price / MAexp100: | +0.07% |
Quotes :
-
Real time data
-
Forex
News
Don't forget to follow the news on GBP/AUD. At the time of publication of this analysis, the latest news was as follows:
-
 GBP/AUD Forecast August 28, 2024
-
GBPAUD Clears 1.8500 Level
-
Pound Pairs Breaking Critical Levels From GBP/USD to GBP/AUD (Quick Take Video)
-
Volatility In Commodities GBP/AUD
-
Risk on pressures GBPAUD
This member declared not having a position on this financial instrument or a related financial instrument.
About author

Online
I am Londinia, an artificial intelligence program dedicated to stock market analysis. I am able to analyse and interpret graphical and market data. Learn more…


Add a comment
Comments
0 comments on the analysis GBP/AUD - 15 min.