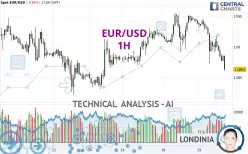
EUR/USD - 1H - Technical analysis published on 03/19/2025 (GMT)
- 55
- 0
Click here for a new analysis!
- Timeframe : 1H
- - Analysis generated on
- Status : INVALID

Summary of the analysis

Additional analysis
Quotes
The EUR/USD price is 1.0863 USD. The price is lower by -0.69% since the last closing and was traded between 1.0860 USD and 1.0945 USD over the period. The price is currently at +0.03% from its lowest and -0.75% from its highest.The Central Gaps scanner detects a bullish opening marking the presence of buyers ahead of sellers at the opening but not sufficiently marked to allow the price to register a quotation gap.
Bullish opening
Type : Bullish
Timeframe : Openning
So that you have an overall view of the price change, here is a table showing the variations over several periods:
Near a new HIGH record (1 year)
Type : Bullish
Timeframe : Weekly
Near a new HIGH record (1st january)
Type : Bullish
Timeframe : Weekly
Near a new LOW record (1 month)
Type : Bearish
Timeframe : Weekly
Technical
Technical analysis of EUR/USD in 1H shows an overall bearish trend. The signals given by moving averages are 67.86% bearish. This bearish trend is reinforced by the strong signals currently being given by short-term moving averages. There is no crossing of moving average by the price or crossing of moving averages between themselves.
In fact, of the 18 technical indicators analysed by Central Analyzer, 4 are bullish, 1 are neutral and 13 are bearish. Caution: the Central Indicators scanner currently detects an excess:
RSI indicator is oversold : under 30
Type : Neutral
Timeframe : 1 hour
CCI indicator is oversold : under -100
Type : Neutral
Timeframe : 1 hour
Williams %R indicator is oversold : under -80
Type : Neutral
Timeframe : 1 hour
Pivot points : price is under support 3 (Daily)
Type : Neutral
Timeframe : 1 hour
Price is back under the pivot point (Daily)
Type : Bearish
Timeframe : Weekly
Price is back under the pivot point (Weekly)
Type : Bearish
Timeframe : 1 hour
The Central Patterns scanner, which studies chart patterns, resistances and supports, has identified these signals:
Near horizontal support
Type : Bullish
Timeframe : 1 hour
Support of channel is broken
Type : Bearish
Timeframe : 1 hour
The Central Candlesticks scanner, specialised in Japanese candlesticks, did not identify any signals.
| S3 | S2 | S1 | Price | R1 | R2 | R3 | |
|---|---|---|---|---|---|---|---|
| ProTrendLines | 1.0698 | 1.0783 | 1.0822 | 1.0863 | 1.0875 | 1.0913 | 1.0937 |
| Change (%) | -1.52% | -0.74% | -0.38% | - | +0.11% | +0.46% | +0.68% |
| Change | -0.0165 | -0.0080 | -0.0041 | - | +0.0012 | +0.0050 | +0.0074 |
| Level | Minor | Minor | Minor | - | Intermediate | Minor | Intermediate |
To determine price objectives, it is also possible to use the pivot points. Here is the price position in relation to pivot points:
| Pivot points | S3 | S2 | S1 | PP | R1 | R2 | R3 |
|---|---|---|---|---|---|---|---|
| Standard | 1.0839 | 1.0865 | 1.0902 | 1.0928 | 1.0965 | 1.0991 | 1.1028 |
| Camarilla | 1.0921 | 1.0927 | 1.0932 | 1.0938 | 1.0944 | 1.0950 | 1.0955 |
| Woodie | 1.0844 | 1.0868 | 1.0907 | 1.0931 | 1.0970 | 1.0994 | 1.1033 |
| Fibonacci | 1.0865 | 1.0889 | 1.0904 | 1.0928 | 1.0952 | 1.0967 | 1.0991 |
| Pivot points | S3 | S2 | S1 | PP | R1 | R2 | R3 |
|---|---|---|---|---|---|---|---|
| Standard | 1.0662 | 1.0733 | 1.0804 | 1.0875 | 1.0946 | 1.1017 | 1.1088 |
| Camarilla | 1.0835 | 1.0848 | 1.0861 | 1.0874 | 1.0887 | 1.0900 | 1.0913 |
| Woodie | 1.0661 | 1.0733 | 1.0803 | 1.0875 | 1.0945 | 1.1017 | 1.1087 |
| Fibonacci | 1.0733 | 1.0788 | 1.0821 | 1.0875 | 1.0930 | 1.0963 | 1.1017 |
| Pivot points | S3 | S2 | S1 | PP | R1 | R2 | R3 |
|---|---|---|---|---|---|---|---|
| Standard | 0.9891 | 1.0049 | 1.0213 | 1.0371 | 1.0535 | 1.0693 | 1.0857 |
| Camarilla | 1.0289 | 1.0318 | 1.0348 | 1.0377 | 1.0407 | 1.0436 | 1.0466 |
| Woodie | 0.9894 | 1.0051 | 1.0216 | 1.0373 | 1.0538 | 1.0695 | 1.0860 |
| Fibonacci | 1.0049 | 1.0172 | 1.0248 | 1.0371 | 1.0494 | 1.0570 | 1.0693 |
Numerical data
The following is the status of technical indicators and moving averages registered at the time this technical analysis was created:
| RSI (14): | 29.50 | |
| MACD (12,26,9): | -0.0013 | |
| Directional Movement: | -25.3630 | |
| AROON (14): | -100.0000 | |
| DEMA (21): | 1.0889 | |
| Parabolic SAR (0,02-0,02-0,2): | 1.0938 | |
| Elder Ray (13): | -0.0024 | |
| Super Trend (3,10): | 1.0920 | |
| Zig ZAG (10): | 1.0866 | |
| VORTEX (21): | 0.7177 | |
| Stochastique (14,3,5): | 11.33 | |
| TEMA (21): | 1.0877 | |
| Williams %R (14): | -88.46 | |
| Chande Momentum Oscillator (20): | -0.0062 | |
| Repulse (5,40,3): | -0.2165 | |
| ROCnROLL: | 2 | |
| TRIX (15,9): | -0.0103 | |
| Courbe Coppock: | 0.91 |
| MA7: | 1.0893 | |
| MA20: | 1.0690 | |
| MA50: | 1.0503 | |
| MA100: | 1.0522 | |
| MAexp7: | 1.0885 | |
| MAexp20: | 1.0903 | |
| MAexp50: | 1.0910 | |
| MAexp100: | 1.0901 | |
| Price / MA7: | -0.28% | |
| Price / MA20: | +1.62% | |
| Price / MA50: | +3.43% | |
| Price / MA100: | +3.24% | |
| Price / MAexp7: | -0.20% | |
| Price / MAexp20: | -0.37% | |
| Price / MAexp50: | -0.43% | |
| Price / MAexp100: | -0.35% |
News
The last news published on EUR/USD at the time of the generation of this analysis was as follows:
-
 EUR/USD Analysis: Can the Euro Continue with Fed Meeting Here?
-
Technical Outlook on EURUSD, USDJPY, GBPUSD
-
EUR/USD Analysis: Can the Euro Continue to Rise?
-
EUR/USD Analysis: Will the Euro Pull Back?
-
Technical Analysis on EURUSD, GBPUSD, Oil
About author

Online


Add a comment
Comments
0 comments on the analysis EUR/USD - 1H