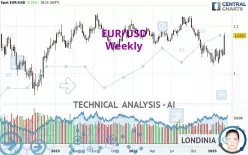
EUR/USD - Weekly - Technical analysis published on 03/06/2025 (GMT)
- 267
- 0
- Timeframe : Weekly
- - Analysis generated on
- Status : NEUTRAL

Summary of the analysis

Additional analysis
Quotes
The EUR/USD rating is 1.0797 USD. Over 5 days, this instrument gained +3.88% and was traded between 1.0388 USD and 1.0854 USD over the period. The price is currently at +3.94% from its lowest point and -0.53% from its highest point.A study of price movements over other periods shows the following variations:
Near a new HIGH record (1 year)
Type : Bullish
Timeframe : Weekly
New HIGH record (1st january)
Type : Bullish
Timeframe : Weekly
New HIGH record (1 month)
Type : Bullish
Timeframe : Weekly
Technical
A technical analysis in Weekly of this EUR/USD chart shows a neutral trend. The slightly bullish signals currently given by short-term moving averages could allow the overall trend to return to a slightly bullish trend. An assessment of moving averages reveals several bullish signals that could impact this trend:
Bullish price crossover with Moving Average 20
Type : Bullish
Timeframe : Weekly
Bullish price crossover with Moving Average 50
Type : Bullish
Timeframe : Weekly
Bullish price crossover with Moving Average 100
Type : Bullish
Timeframe : Weekly
Bullish price crossover with adaptative moving average 20
Type : Bullish
Timeframe : Weekly
Bullish price crossover with adaptative moving average 50
Type : Bullish
Timeframe : Weekly
Bullish price crossover with adaptative moving average 100
Type : Bullish
Timeframe : Weekly
The probability of a further increase are moderate given the direction of the technical indicators.
Caution: the Central Indicators scanner currently detects an excess:
Williams %R indicator is overbought : over -20
Type : Neutral
Timeframe : Weekly
Pivot points : price is over resistance 3
Type : Neutral
Timeframe : Weekly
RSI indicator is back over 50
Type : Bullish
Timeframe : Weekly
Aroon indicator bullish trend
Type : Bullish
Timeframe : Weekly
SuperTrend indicator bullish reversal
Type : Bullish
Timeframe : Weekly
Momentum indicator is back over 0
Type : Bullish
Timeframe : Weekly
The Central Patterns scanner, which studies chart patterns, resistances and supports, has identified these signals:
Near horizontal resistance
Type : Bearish
Timeframe : Weekly
Near resistance of triangle
Type : Bearish
Timeframe : Weekly
Resistance of channel is broken
Type : Bullish
Timeframe : Weekly
No result was found by the Central Candlesticks scanner on Japanese candlesticks.
| S2 | S1 | Price | R1 | R2 | R3 | |
|---|---|---|---|---|---|---|
| ProTrendLines | 0.9596 | 1.0430 | 1.0797 | 1.1192 | 1.1456 | 1.1886 |
| Change (%) | -11.12% | -3.40% | - | +3.66% | +6.10% | +10.09% |
| Change | -0.1201 | -0.0367 | - | +0.0395 | +0.0659 | +0.1089 |
| Level | Major | Major | - | Major | Minor | Minor |
Attention could also be paid to pivot points to set price objectives:
| Pivot points | S3 | S2 | S1 | PP | R1 | R2 | R3 |
|---|---|---|---|---|---|---|---|
| Standard | 1.0470 | 1.0536 | 1.0665 | 1.0731 | 1.0860 | 1.0926 | 1.1055 |
| Camarilla | 1.0740 | 1.0758 | 1.0776 | 1.0794 | 1.0812 | 1.0830 | 1.0848 |
| Woodie | 1.0502 | 1.0552 | 1.0697 | 1.0747 | 1.0892 | 1.0942 | 1.1087 |
| Fibonacci | 1.0536 | 1.0611 | 1.0657 | 1.0731 | 1.0806 | 1.0852 | 1.0926 |
| Pivot points | S3 | S2 | S1 | PP | R1 | R2 | R3 |
|---|---|---|---|---|---|---|---|
| Standard | 1.0146 | 1.0253 | 1.0315 | 1.0422 | 1.0484 | 1.0591 | 1.0653 |
| Camarilla | 1.0331 | 1.0346 | 1.0362 | 1.0377 | 1.0393 | 1.0408 | 1.0424 |
| Woodie | 1.0124 | 1.0242 | 1.0293 | 1.0411 | 1.0462 | 1.0580 | 1.0631 |
| Fibonacci | 1.0253 | 1.0318 | 1.0357 | 1.0422 | 1.0487 | 1.0526 | 1.0591 |
| Pivot points | S3 | S2 | S1 | PP | R1 | R2 | R3 |
|---|---|---|---|---|---|---|---|
| Standard | 0.9891 | 1.0049 | 1.0213 | 1.0371 | 1.0535 | 1.0693 | 1.0857 |
| Camarilla | 1.0289 | 1.0318 | 1.0348 | 1.0377 | 1.0407 | 1.0436 | 1.0466 |
| Woodie | 0.9894 | 1.0051 | 1.0216 | 1.0373 | 1.0538 | 1.0695 | 1.0860 |
| Fibonacci | 1.0049 | 1.0172 | 1.0248 | 1.0371 | 1.0494 | 1.0570 | 1.0693 |
Numerical data
The following are the details of the technical indicators and moving averages that were collected to generate this technical analysis:
| RSI (14): | 57.68 | |
| MACD (12,26,9): | -0.0079 | |
| Directional Movement: | 2.1256 | |
| AROON (14): | 50.0000 | |
| DEMA (21): | 1.0421 | |
| Parabolic SAR (0,02-0,02-0,2): | 1.0233 | |
| Elder Ray (13): | 0.0122 | |
| Super Trend (3,10): | 0.9990 | |
| Zig ZAG (10): | 1.0795 | |
| VORTEX (21): | 0.8731 | |
| Stochastique (14,3,5): | 65.85 | |
| TEMA (21): | 1.0405 | |
| Williams %R (14): | -9.02 | |
| Chande Momentum Oscillator (20): | 0.0292 | |
| Repulse (5,40,3): | 4.2809 | |
| ROCnROLL: | 1 | |
| TRIX (15,9): | -0.1638 | |
| Courbe Coppock: | 2.67 |
| MA7: | 1.0565 | |
| MA20: | 1.0480 | |
| MA50: | 1.0409 | |
| MA100: | 1.0517 | |
| MAexp7: | 1.0506 | |
| MAexp20: | 1.0539 | |
| MAexp50: | 1.0664 | |
| MAexp100: | 1.0746 | |
| Price / MA7: | +2.20% | |
| Price / MA20: | +3.02% | |
| Price / MA50: | +3.73% | |
| Price / MA100: | +2.66% | |
| Price / MAexp7: | +2.77% | |
| Price / MAexp20: | +2.45% | |
| Price / MAexp50: | +1.25% | |
| Price / MAexp100: | +0.47% |
News
The last news published on EUR/USD at the time of the generation of this analysis was as follows:
-
 Technical Analysis on EURUSD, GBPUSD, Oil
-
EUR/USD Analysis: Euro Remains Rangebound
-
EUR/USD Analysis: Can We Break Out of the Range?
-
EUR/USD Analysis: Are We at the Top?
-
EUR/USD Long Position Success & USD/JPY Short Setup | Trade of the Week February 2025
About author

Online


Add a comment
Comments
0 comments on the analysis EUR/USD - Weekly