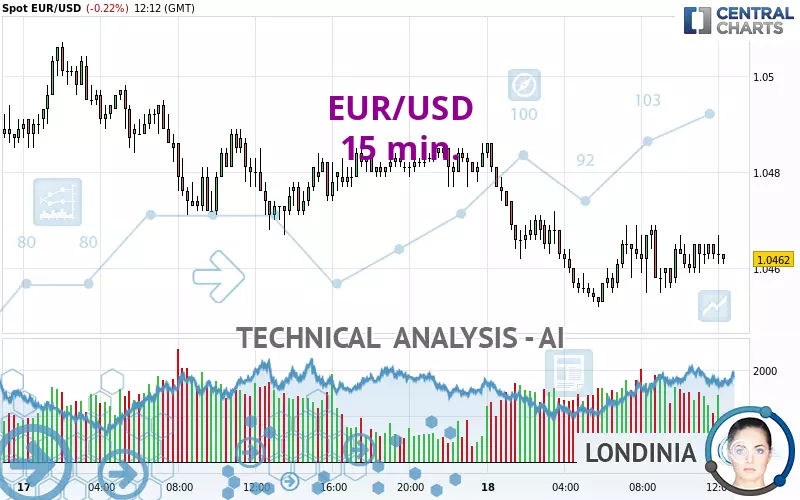
EUR/USD - 15 min. - Technical analysis published on 02/18/2025 (GMT)
- 96
- 0
Click here for a new analysis!
- Timeframe : 15 min.
- - Analysis generated on
- Status : TARGET REACHED

Summary of the analysis

Additional analysis
Quotes
The EUR/USD rating is 1.0462 USD. On the day, this instrument lost -0.22% with the lowest point at 1.0452 USD and the highest point at 1.0486 USD. The deviation from the price is +0.10% for the low point and -0.23% for the high point.Here is a more detailed summary of the historical variations registered by EUR/USD:
Near a new LOW record (1 year)
Type : Bearish
Timeframe : Weekly
Near a new LOW record (1st january)
Type : Bearish
Timeframe : Weekly
Near a new LOW record (1 month)
Type : Bearish
Timeframe : Weekly
Technical
A technical analysis in 15 min. of this EUR/USD chart shows a bearish trend. 71.43% of the signals given by moving averages are bearish. Caution: the neutral signals currently given by short-term moving averages show us that the global trend is losing momentum. The Central Indicators scanner does not detect any result on moving averages that would impact this trend.
The probability of a further increase are moderate given the direction of the technical indicators.
Central Indicators, the scanner specialised in technical indicators, has identified these signals:
Pivot points : price is under support 1
Type : Neutral
Timeframe : 15 minutes
Momentum indicator is back under 0
Type : Bearish
Timeframe : 15 minutes
No signals are given by Central Patterns, a market scanner specialised in chart patterns, resistances and supports.
There is also a Japanese candlestick pattern detected by Central Candlesticks that could mark the end of the current short-term trend:
Doji
Type : Neutral
Timeframe : 15 minutes
| S3 | S2 | S1 | Price | R1 | R2 | R3 | |
|---|---|---|---|---|---|---|---|
| ProTrendLines | 1.0292 | 1.0373 | 1.0430 | 1.0462 | 1.0467 | 1.0486 | 1.0514 |
| Change (%) | -1.62% | -0.85% | -0.31% | - | +0.05% | +0.23% | +0.50% |
| Change | -0.0170 | -0.0089 | -0.0032 | - | +0.0005 | +0.0024 | +0.0052 |
| Level | Minor | Intermediate | Major | - | Intermediate | Minor | Intermediate |
Attention could also be paid to pivot points to set price objectives:
| Pivot points | S3 | S2 | S1 | PP | R1 | R2 | R3 |
|---|---|---|---|---|---|---|---|
| Standard | 1.0426 | 1.0446 | 1.0466 | 1.0486 | 1.0506 | 1.0526 | 1.0546 |
| Camarilla | 1.0474 | 1.0478 | 1.0481 | 1.0485 | 1.0489 | 1.0492 | 1.0496 |
| Woodie | 1.0425 | 1.0446 | 1.0465 | 1.0486 | 1.0505 | 1.0526 | 1.0545 |
| Fibonacci | 1.0446 | 1.0462 | 1.0471 | 1.0486 | 1.0502 | 1.0511 | 1.0526 |
| Pivot points | S3 | S2 | S1 | PP | R1 | R2 | R3 |
|---|---|---|---|---|---|---|---|
| Standard | 1.0105 | 1.0192 | 1.0341 | 1.0428 | 1.0577 | 1.0664 | 1.0813 |
| Camarilla | 1.0426 | 1.0448 | 1.0469 | 1.0491 | 1.0513 | 1.0534 | 1.0556 |
| Woodie | 1.0137 | 1.0208 | 1.0373 | 1.0444 | 1.0609 | 1.0680 | 1.0845 |
| Fibonacci | 1.0192 | 1.0282 | 1.0338 | 1.0428 | 1.0518 | 1.0574 | 1.0664 |
| Pivot points | S3 | S2 | S1 | PP | R1 | R2 | R3 |
|---|---|---|---|---|---|---|---|
| Standard | 0.9829 | 1.0004 | 1.0184 | 1.0359 | 1.0539 | 1.0714 | 1.0894 |
| Camarilla | 1.0267 | 1.0300 | 1.0333 | 1.0365 | 1.0398 | 1.0430 | 1.0463 |
| Woodie | 0.9833 | 1.0005 | 1.0188 | 1.0360 | 1.0543 | 1.0715 | 1.0898 |
| Fibonacci | 1.0004 | 1.0139 | 1.0223 | 1.0359 | 1.0494 | 1.0578 | 1.0714 |
Numerical data
The following are the details of the technical indicators and moving averages that were collected to generate this technical analysis:
| RSI (14): | 50.84 | |
| MACD (12,26,9): | 0.0000 | |
| Directional Movement: | 1.4963 | |
| AROON (14): | -7.1428 | |
| DEMA (21): | 1.0462 | |
| Parabolic SAR (0,02-0,02-0,2): | 1.0466 | |
| Elder Ray (13): | 0.0002 | |
| Super Trend (3,10): | 1.0449 | |
| Zig ZAG (10): | 1.0464 | |
| VORTEX (21): | 1.0606 | |
| Stochastique (14,3,5): | 61.90 | |
| TEMA (21): | 1.0464 | |
| Williams %R (14): | -35.71 | |
| Chande Momentum Oscillator (20): | 0.0006 | |
| Repulse (5,40,3): | 0.0110 | |
| ROCnROLL: | -1 | |
| TRIX (15,9): | -0.0009 | |
| Courbe Coppock: | 0.01 |
| MA7: | 1.0422 | |
| MA20: | 1.0407 | |
| MA50: | 1.0394 | |
| MA100: | 1.0572 | |
| MAexp7: | 1.0463 | |
| MAexp20: | 1.0462 | |
| MAexp50: | 1.0465 | |
| MAexp100: | 1.0470 | |
| Price / MA7: | +0.38% | |
| Price / MA20: | +0.53% | |
| Price / MA50: | +0.65% | |
| Price / MA100: | -1.04% | |
| Price / MAexp7: | -0.01% | |
| Price / MAexp20: | -0% | |
| Price / MAexp50: | -0.03% | |
| Price / MAexp100: | -0.08% |
News
The last news published on EUR/USD at the time of the generation of this analysis was as follows:
-
 EUR/USD Long Position Success & USD/JPY Short Setup | Trade of the Week February 2025
-
EUR/USD trading strategy: how Trump's tariffs changed everything | Trade of the Week February 2025
-
EUR/USD Analysis: Can the Euro Continue to Rise?
-
Technical Outlook on EURUSD, USDJPY, GBPUSD
-
EUR/USD Analysis: Is the Range Settled?
About author

Online


Add a comment
Comments
0 comments on the analysis EUR/USD - 15 min.