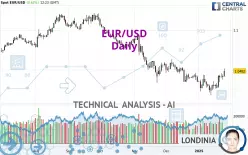
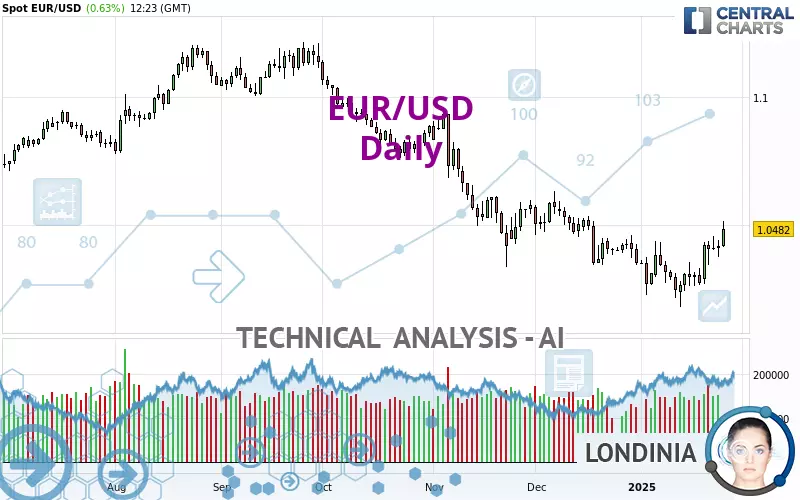
EUR/USD - Daily - Technical analysis published on 01/24/2025 (GMT)
- 191
- 0
Click here for a new analysis!
- Timeframe : Daily
- - Analysis generated on
- Status : INVALID
Summary of the analysis

Additional analysis
Quotes
The EUR/USD price is 1.0482 USD. On the day, this instrument gained +0.63% and was between 1.0411 USD and 1.0515 USD. This implies that the price is at +0.68% from its lowest and at -0.31% from its highest.A study of price movements over other periods shows the following variations:
Near a new LOW record (1 year)
Type : Bearish
Timeframe : Weekly
New HIGH record (1st january)
Type : Bullish
Timeframe : Weekly
New HIGH record (1 month)
Type : Bullish
Timeframe : Weekly
Technical
Technical analysis of this Daily chart of EUR/USD indicates that the overall trend is slightly bearish. 57.14% of the signals given by moving averages are bearish. Caution: the strong bullish signals currently being given by short-term moving averages indicate that this slightly bearish trend could quickly be reversed. An assessment of moving averages reveals several bullish signals that could impact this trend:
Bullish price crossover with Moving Average 50
Type : Bullish
Timeframe : Daily
Bullish price crossover with adaptative moving average 20
Type : Bullish
Timeframe : Daily
Bullish price crossover with adaptative moving average 50
Type : Bullish
Timeframe : Daily
The probability of a further increase are moderate given the direction of the technical indicators.
Caution: the Central Indicators scanner currently detects an excess:
CCI indicator is overbought : over 100
Type : Neutral
Timeframe : Daily
Williams %R indicator is overbought : over -20
Type : Neutral
Timeframe : Daily
Pivot points : price is over resistance 2
Type : Neutral
Timeframe : Daily
Pivot points : price is over resistance 2
Type : Neutral
Timeframe : Weekly
SuperTrend indicator bullish reversal
Type : Bullish
Timeframe : Daily
Ichimoku - Bullish crossover : Tenkan & Kijun
Type : Bullish
Timeframe : Daily
An analysis of the price chart with the Central Patterns scanner (detector of chart patterns and resistances and supports) shows a result that can have an impact on the price change:
Near resistance of channel
Type : Bearish
Timeframe : Daily
No result was found by the Central Candlesticks scanner on Japanese candlesticks.
| S3 | S2 | S1 | Price | R1 | R2 | R3 | |
|---|---|---|---|---|---|---|---|
| ProTrendLines | 1.0129 | 1.0272 | 1.0430 | 1.0482 | 1.0585 | 1.0693 | 1.0908 |
| Change (%) | -3.37% | -2.00% | -0.50% | - | +0.98% | +2.01% | +4.06% |
| Change | -0.0353 | -0.0210 | -0.0052 | - | +0.0103 | +0.0211 | +0.0426 |
| Level | Minor | Major | Major | - | Minor | Intermediate | Minor |
To determine price objectives, it is also possible to use the pivot points. Here is the price position in relation to pivot points:
| Pivot points | S3 | S2 | S1 | PP | R1 | R2 | R3 |
|---|---|---|---|---|---|---|---|
| Standard | 1.0313 | 1.0343 | 1.0379 | 1.0409 | 1.0445 | 1.0475 | 1.0511 |
| Camarilla | 1.0398 | 1.0404 | 1.0410 | 1.0416 | 1.0422 | 1.0428 | 1.0434 |
| Woodie | 1.0317 | 1.0345 | 1.0383 | 1.0411 | 1.0449 | 1.0477 | 1.0515 |
| Fibonacci | 1.0343 | 1.0368 | 1.0384 | 1.0409 | 1.0434 | 1.0450 | 1.0475 |
| Pivot points | S3 | S2 | S1 | PP | R1 | R2 | R3 |
|---|---|---|---|---|---|---|---|
| Standard | 1.0006 | 1.0092 | 1.0182 | 1.0268 | 1.0358 | 1.0444 | 1.0534 |
| Camarilla | 1.0224 | 1.0240 | 1.0256 | 1.0272 | 1.0288 | 1.0304 | 1.0320 |
| Woodie | 1.0008 | 1.0093 | 1.0184 | 1.0269 | 1.0360 | 1.0445 | 1.0536 |
| Fibonacci | 1.0092 | 1.0159 | 1.0201 | 1.0268 | 1.0335 | 1.0377 | 1.0444 |
| Pivot points | S3 | S2 | S1 | PP | R1 | R2 | R3 |
|---|---|---|---|---|---|---|---|
| Standard | 0.9965 | 1.0154 | 1.0252 | 1.0441 | 1.0539 | 1.0728 | 1.0826 |
| Camarilla | 1.0271 | 1.0297 | 1.0324 | 1.0350 | 1.0376 | 1.0403 | 1.0429 |
| Woodie | 0.9920 | 1.0131 | 1.0207 | 1.0418 | 1.0494 | 1.0705 | 1.0781 |
| Fibonacci | 1.0154 | 1.0264 | 1.0331 | 1.0441 | 1.0551 | 1.0618 | 1.0728 |
Numerical data
The following are the details of the technical indicators and moving averages that were collected to generate this technical analysis:
| RSI (14): | 59.50 | |
| MACD (12,26,9): | -0.0009 | |
| Directional Movement: | 7.7025 | |
| AROON (14): | 64.2857 | |
| DEMA (21): | 1.0349 | |
| Parabolic SAR (0,02-0,02-0,2): | 1.0250 | |
| Elder Ray (13): | 0.0086 | |
| Super Trend (3,10): | 1.0207 | |
| Zig ZAG (10): | 1.0484 | |
| VORTEX (21): | 1.0158 | |
| Stochastique (14,3,5): | 86.08 | |
| TEMA (21): | 1.0395 | |
| Williams %R (14): | -9.20 | |
| Chande Momentum Oscillator (20): | 0.0171 | |
| Repulse (5,40,3): | 1.0672 | |
| ROCnROLL: | -1 | |
| TRIX (15,9): | -0.0535 | |
| Courbe Coppock: | 0.87 |
| MA7: | 1.0387 | |
| MA20: | 1.0346 | |
| MA50: | 1.0438 | |
| MA100: | 1.0692 | |
| MAexp7: | 1.0402 | |
| MAexp20: | 1.0378 | |
| MAexp50: | 1.0464 | |
| MAexp100: | 1.0596 | |
| Price / MA7: | +0.91% | |
| Price / MA20: | +1.31% | |
| Price / MA50: | +0.42% | |
| Price / MA100: | -1.96% | |
| Price / MAexp7: | +0.77% | |
| Price / MAexp20: | +1.00% | |
| Price / MAexp50: | +0.17% | |
| Price / MAexp100: | -1.08% |
News
The last news published on EUR/USD at the time of the generation of this analysis was as follows:
-
 EUR/USD Outlook - Can the Euro Continue Higher?
-
EUR/USD Price Outlook - Can the Euro Find Buyers?
-
Technical Outlook on USDJPY, EURUSD, USDCAD
-
EUR/USD Price Forecast Can the Euro Ever Recover? (January 8, 2025 Forecast)
-
EUR/USD Price Forecast - Euro Rallies, So What?
About author

Online


Add a comment
Comments
0 comments on the analysis EUR/USD - Daily